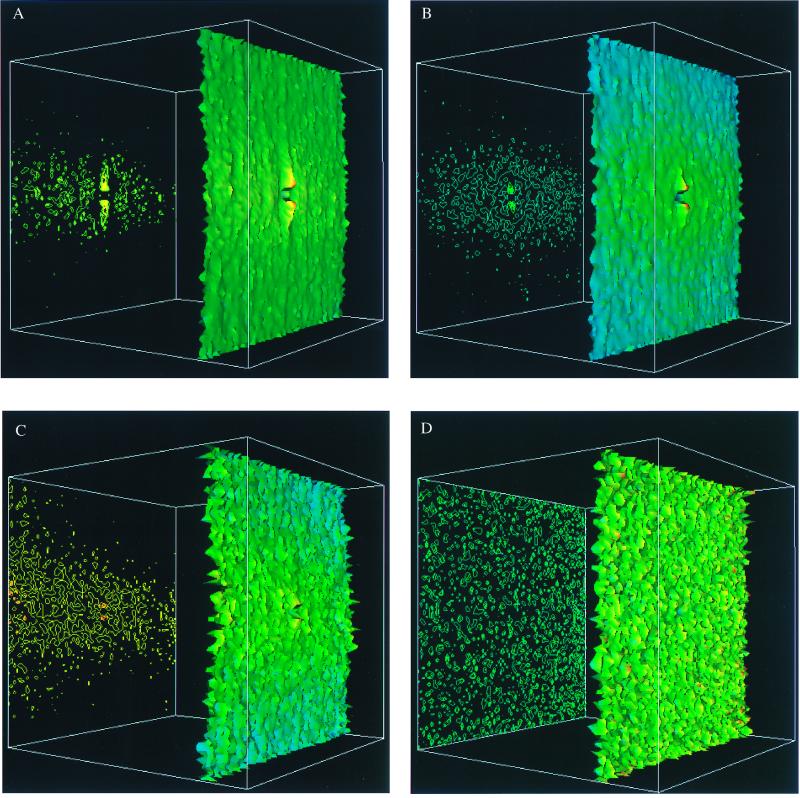
Figure 2.
Three-dimensional color surface representations (right) and the corresponding contour maps (left) of the neuron density g(x, y) in a population of brain STS association cortex, calculated by using the method described in the text. The corners of the grid have coordinates (±400 μm, ±400 μm). The height of the surface is in an absolute scale for all of the figures whereas the color code is normalized for each figure separately such that the maximal value of g(x, y) corresponds to red and the minimal value of g(x, y) to blue. A shows g(x, y) in control brain STS association cortex, averaged over the population of 11 different cases (n = 22,007 neurons). The average density is 660 neurons/mm2, the minimal density is 434 neurons/mm2, and the maximal density is 845 neurons/mm2. B shows g(x, y) in Alzheimer disease STS cortex averaged over the population of 22 cases (n = 19,391 neurons). The average density is 488 neurons/mm2, the minimal density is 381 neurons/mm2, and the maximal density is 669 neurons/mm2. C shows g(x, y) in STS cortex of dementia with Lewy bodies, averaged over a population of five different cases (n = 6,751 neurons). The average density is 693 neurons/mm2, the minimal density is 480 neurons/mm2, and the maximal density is 948 neurons/mm2. D shows g(x, y) computed from a random distribution of positions as in Fig. 1d. The average density is 513 neurons/mm2, the minimal density is 258 neurons/mm2, and the maximal density is 696 neurons/mm2.

