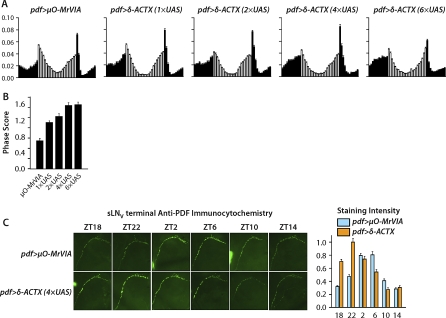
Figure 7. Membrane-Tethered δ-ACTX-Hv1a Expression in PDF-Secreting LNVs Induces Phase Advance of Both Morning Anticipatory Locomotor Activity and PDF Accumulation in the Dorsomedial Terminals of sLNVs.
Flies with pdf-GAL4 and either UAS- δ-ACTX-Hv1a (4×UAS) or UAS-μO-MrVIA transgenes were entrained for at least 4 d in 12-h:12-h LD conditions and then brains were processed for anti-PDF immunofluorescence. Green anti-PDF signal indicates cytoplasmic PDF accumulation in sLNV dorsomedial terminals.
(A) Average activity histograms indicate relative levels of locomotor activity versus time for flies of the indicated genotypes over 5 d in LD. Each bar represents 30-min cumulative activity, with white and black bars indicating the day and night phases. Flies expressing membrane-tethered δ-ACTX-Hv1a exhibit phase advanced lights-on anticipation as revealed by the change in shape of the envelope of relative activity in the 3 h prior to lights-on from concave to convex with increasing membrane-tethered δ-ACTX-Hv1a expression.
(B) Bar graph shows computed phase scores (mean ± SEM) for lights-on anticipation, defined as relative cumulative activity in the 3 h just before lights-on divided by the 3 h just after lights-on. Indicated genotypes represent flies expressing either membrane-tethered μO-MrVIA or δ-ACTX-Hv1a with one, two, four or six copies of UAS. Membrane-tethered δ-ACTX-Hv1a expression dose-dependently phase advances morning anticipation of lights-on. The difference between control pdf>μO-MrVIA and each of the pdf> δ-ACTX-Hv1a genotypes is statistically significant by ANOVA with Tukey-Kramer multiple comparison (p < 0.001).
(C) Bar graphs show normalized integrated anti-PDF staining intensity (mean ± SEM). Representative immunofluorescence images of sLNV dorsomedial terminals from flies of the indicated genotypes at the indicated time points are shown. Control flies expressing membrane-tethered μO-MrVIA exhibit peak PDF accumulation at ZT2–ZT6 and trough at ZT14–ZT18 (p < 0.001). In contrast, membrane-tethered δ-ACTX-Hv1a–expressing flies exhibit peak PDF accumulation at ZT22 and trough at ZT10–ZT14 (p < 0.001), representing an approximately 4-h phase advance of the rhythm of PDF accumulation. The differences among different genotypes at different circadian times were compared with ANOVA and Tukey-Kramer multiple comparisons. n > 22 brain hemispheres for each experimental group.

