
Fig. 4.
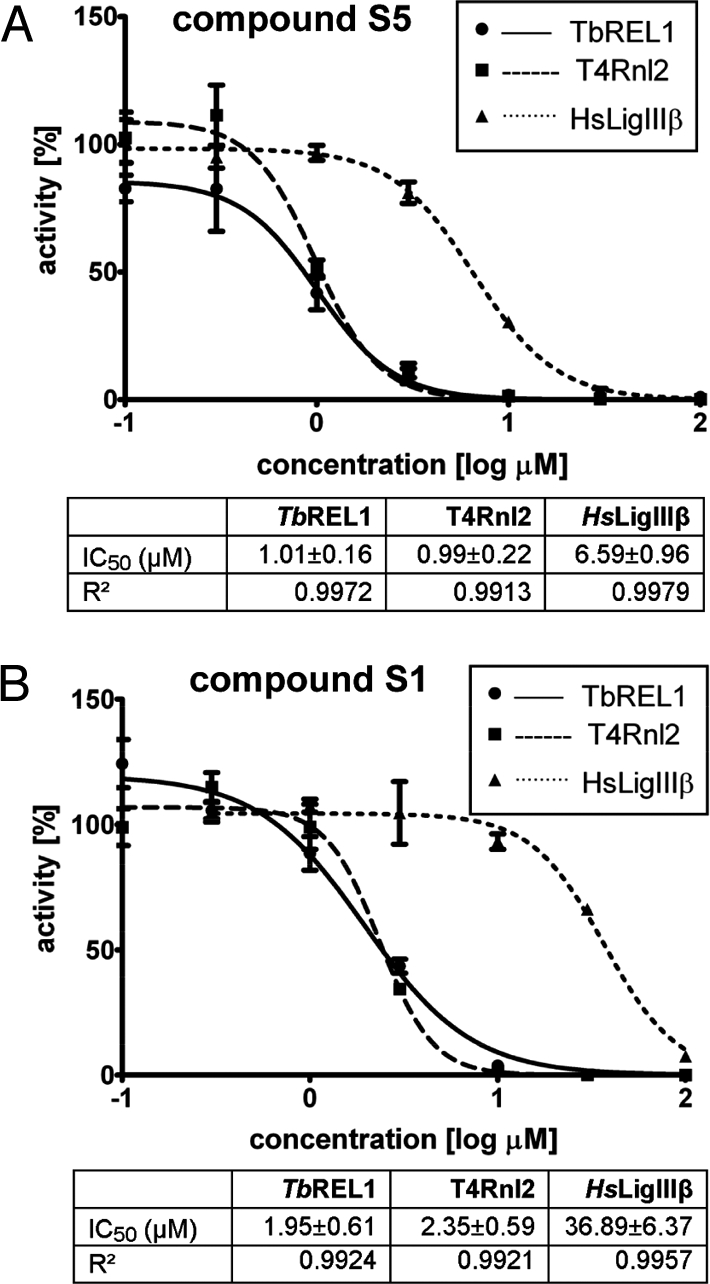
Second round of inhibitor testing. (A) Dose–response curve for S5 vs. TbREL1 (solid line, circles), T4Rnl2 (dashed line, squares), and HsLigIIIβ (dotted line, triangles). Corresponding IC50 and R2 values are listed beneath. (B) Same for S1.
Official websites use .gov
A
.gov website belongs to an official
government organization in the United States.
Secure .gov websites use HTTPS
A lock (
) or https:// means you've safely
connected to the .gov website. Share sensitive
information only on official, secure websites.
Second round of inhibitor testing. (A) Dose–response curve for S5 vs. TbREL1 (solid line, circles), T4Rnl2 (dashed line, squares), and HsLigIIIβ (dotted line, triangles). Corresponding IC50 and R2 values are listed beneath. (B) Same for S1.