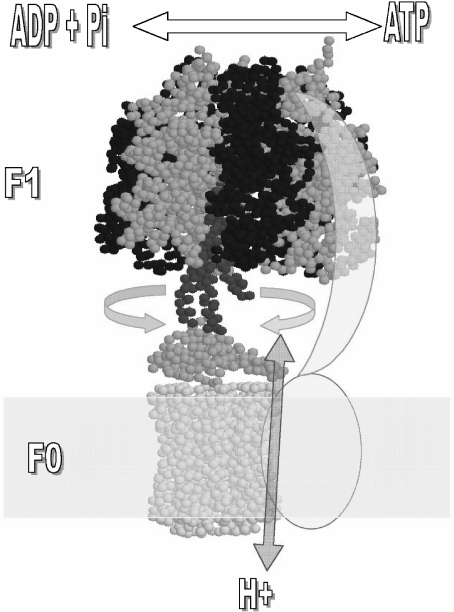
Fig. 1.
Rotor–stator subunit distribution in the mitochondrial F1F0-ATP synthase. Only the core subunits present in bacteria and mitochondria are shown for simplicity. Rotating subunits are shown in red (γ), orange (ε), and yellow (ring of c subunits) whereas static subunits are in dark blue (β), blue (α), and cyan (subunits a and b). The arrows indicate the reversible rotation of γ–ε–c subunits relative to α and β catalytic subunits of F1 that takes place during ATP synthesis (“clockwise” or right direction) and hydrolysis (“counterclockwise” or left direction). Bidirectional proton flow at the c-ring–sub a interface occurs associated with the gyration of the rotor as indicated by the red arrow. The second-stalk structure is simplified as two cyan subunits (a and b) that work as stator to anchor the catalytic α3β3 to the membranous a subunit. Image is generated in RasMol 2.6 from the mitochondrial F1F0 structure of S. cerevisiae (PDB code 1Q01) and edited as shown

