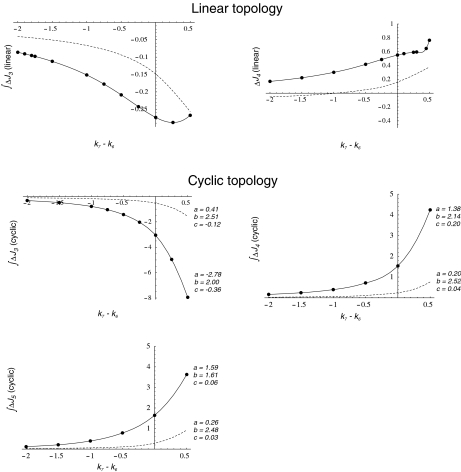
Fig. 6.
Integrated ΔJi (in nonregulated minus regulated systems) as function of the difference k7 − k6 calculated for the first 10-min simulation, when the N-source was diminishing at a rate defined by  . Dots, calculated values from the simulations. Lines, interpolations for the linear topology (upper panel) or resolution of
  for the cyclic topology (lower panel) with values for a, b, and c as indicated. Continuous line, GS 240 nM; dashed line, GS 2,400 nM

