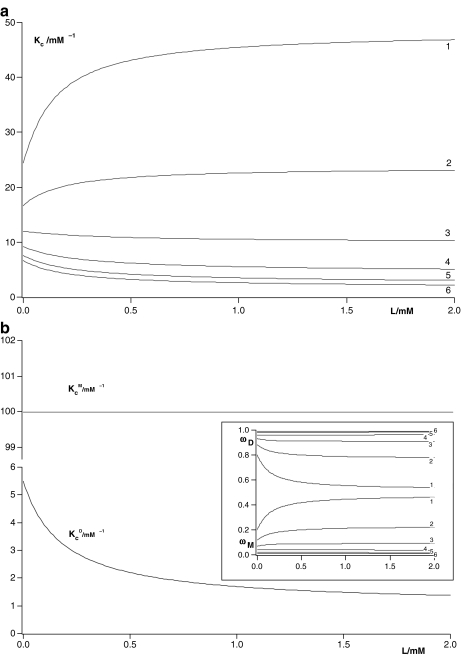
Fig. 8.
a Global association quotient, Kc, as a function of the ligand concentration, L, for different total monomer (mM) concentrations, Pt = 1 (1); 100.5 (2); 10 (3); 101.5 (4); 102 (5); 102.5 (6). The parameter values used are  ; Kd = 10 mM;
  ;
;  ;
;  ;
;  and Ke = 1. Partial association quotients, Kc,i and fractions of free sites, ωi, as functions of the ligand and total monomer concentrations, for the different levels of the hierarchical decomposition of Kc: b
 and
and  (aggregation level); c
 and
and  (conformational level)

