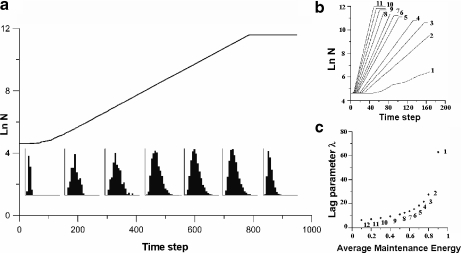
Fig. 4.
a Total population (solid line) and biomass distribution function (histograms) of a simulated culture through time. b Results of the series of simulations performed with different maintenance energy constants: growth curves (ln N) of the different simulations. c Lag time duration versus maintenance energy constant for the simulations shown in (b). Reprinted from [86] with permission from Elsevier

