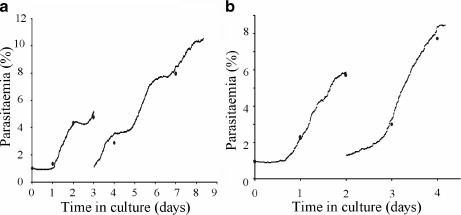
Fig. 6.
Simulated data compared to experimental results obtained from two different commercial culture media, performed according to the MR4 protocol after one week of culture. Blue dots represent experimental results. Black small dots represent simulation results. a Simulated and experimental results from a synchronous culture. b Simulated and experimental results from an asynchronous culture. Reprinted from [91] with permission from Elsevier

