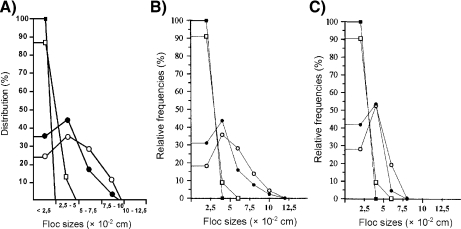
Fig. 7.
Size distribution of the flocs, as a function of their magnitude, of the brewing yeast S. cerevisiae at different agitation rates: (open circles) 250 rpm; (filled circles) 500 rpm; (open squares) 750 rpm; (filled squares) 1,000 rpm. a Experimental results after [96]. b Simulation results for the cascade model. c Simulation results for the addition model. Reprinted from [88] with permission from Elsevier

