
Fig. 2.
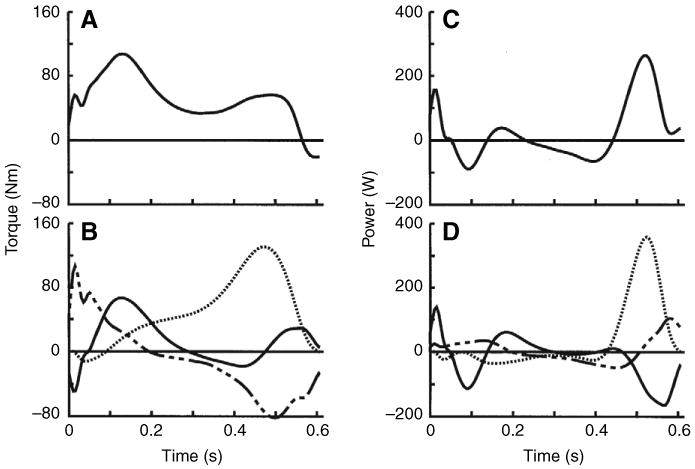
(A,C) Summed joint torque (A) and joint power (C) and (B,D) individual hip (broken line), knee (solid line) and ankle (dotted line) joint torques (B) and joint powers (D) during the stance phase of level walking averaged across all subjects. Positive torques are extensors and positive powers are energy generation. Summed torque showed extensor bias throughout most of stance that was produced primarily by hip and knee extensor torques in early stance and ankle plantarflexor torque in late stance. Individual joint powers showed that each joint torque generated and dissipated energy during the stance phase. Summed joint power showed alternating positive and negative work phases, with the largest power magnitude being the positive power in late stance.