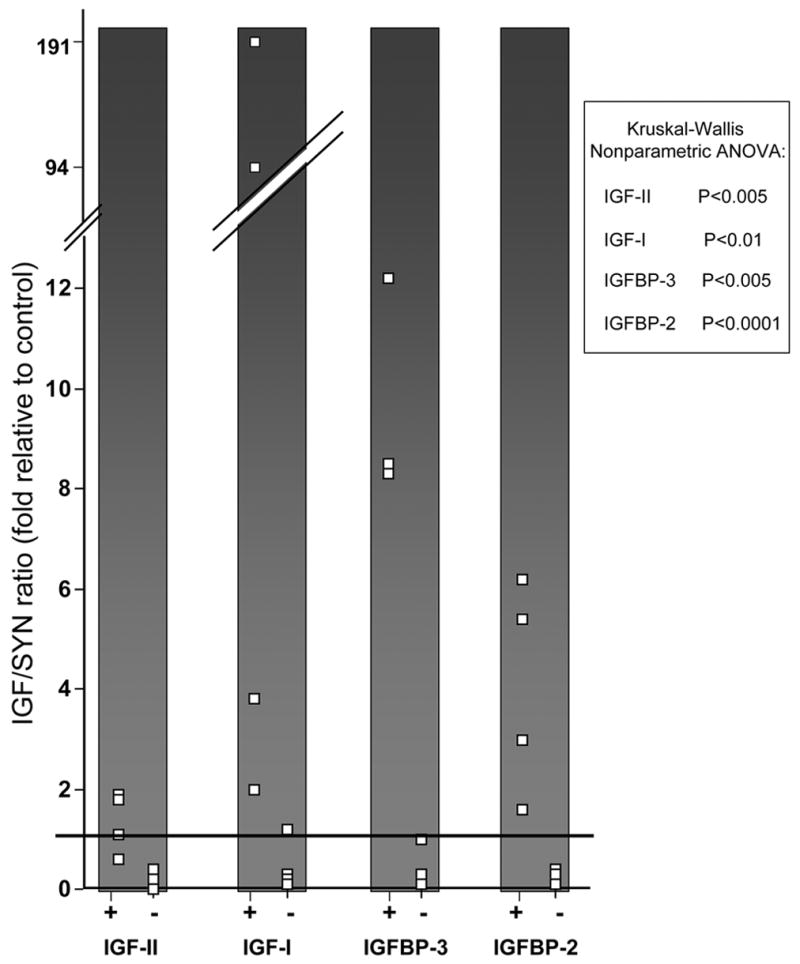
Fig. 1. IGF axis/synaptophysin mRNA ratios in PPNAD.

Expression of IGF-II, IGF-I, IGFBP-3 and IGFBP-2 were measured by Real-time quantitative RT-PCR. For each gene, the results are displayed according to PRKAR1A mutation status (positive,+; negative,−). Each white box depicts the message ratio of the IGF axis member to synaptophysin for an individual patient, expressed as fold difference from the ratio measured in the normal control RNA. Each box is the average of quadruplicate raw measures, each normalized to PGK. To facilitate visualization of any overlap between the patient groups, the normal control value of 1 is indicated by the black horizontal bar. Ratio values for each IGF axis member/synaptophysin significantly differed between patient groups, as shown.
