
Fig. 1.
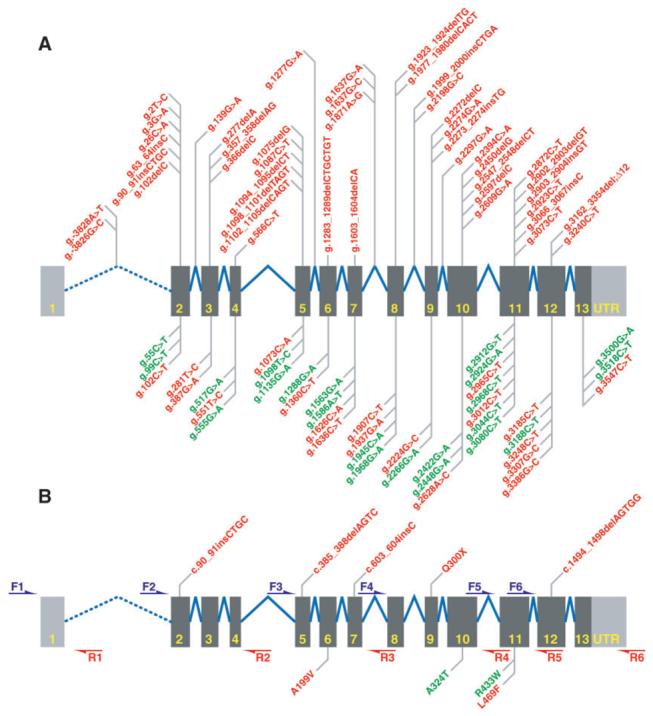
Schematic of GRN showing (A) exons (dark grey bars), UTR (light grey bars) and introns (not to scale, blue lines). Probable null mutations and mutations with unclear pathogenicity are shown above or below the introns/exons respectively (red). Known polymorphisms (green). (B) Screening strategy with six PCR primer pairs (F = forward primer; R = reverse primer); pathogenic and possibly pathogenic mutations (red) are shown above or below the introns/exons respecetively. Also shown are known polymorphisms (green) detected in our screen.