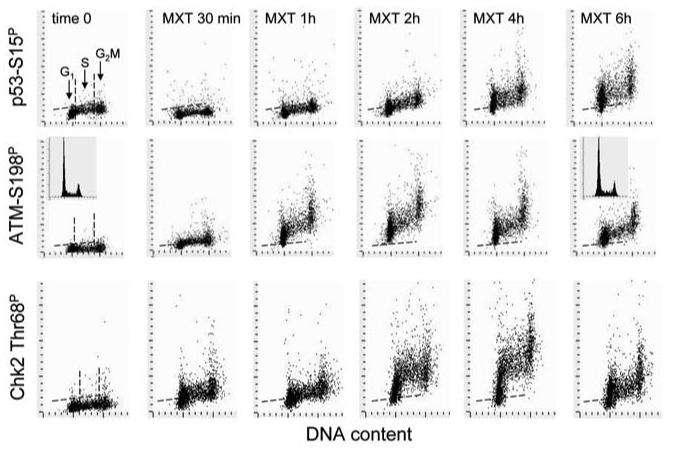
Figure 3.
Induction of phosphorylation of p53 on Ser15, ATM on Ser1981 and Chk2 on Thr68 in A549 cells treated with MXT. The bivariate distributions (scatterplots) of DNA content versus p53S15P, (top), ATM-Ser1981P (mid), or Chk2Thr68P (bottom) of A549 cells treated with 0.2 μM MXT for up to 6 h. The cells in G1, S and G2M can be identified and gated based on difference in cellular DNA content, as shown by vertical dashed lines in the control (0 time) cultures. The dashed skewed lines represent the upper threshold level of IF for 97% of interphase (G1 + S) cells in the respective untreated (time 0) cultures. The insets in the DNA versus ATM-Ser1981P distributions show DNA content histograms of cells from untreated (left) or 6 h MXT treated (right) cultures.

