
Figure 4.
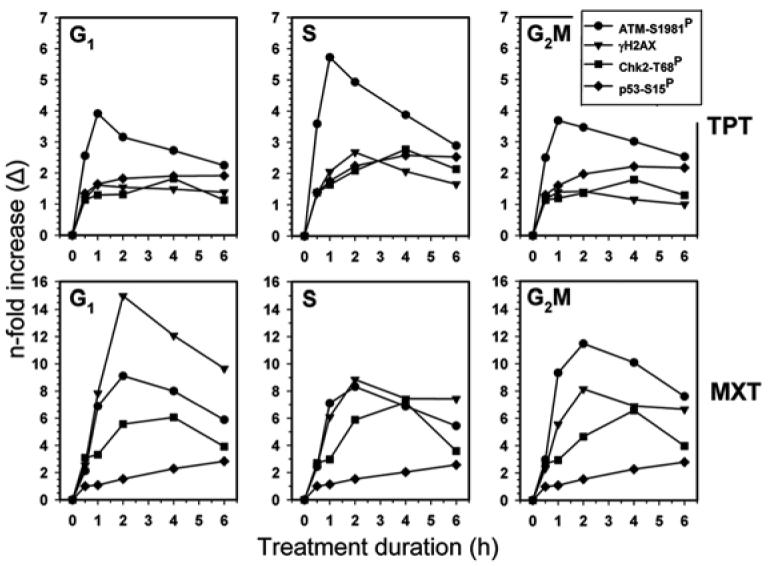
Kinetics of p53-Ser15, ATM-Ser1981, Chk2-Thr68 and H2AX-Ser139 phosphorylation during treatment of A549 cells with TPT or MXT. The data show mean values of p53-Ser15P, ATM-Ser1981P, Chk-68ThrP and γH2AX IF estimated by gating analysis, based on differences in DNA content, separately for subpopulations of cells in G1, S and G2M phases of the cell cycle at each time point of the treatment as described in Materials and Methods. The data represent the n-fold increase (Δ) in the level of expression of these proteins phosphorylated at the respective sites over the level of their constitutive expression of the phosphorylated state.45-48