
Figure 5.
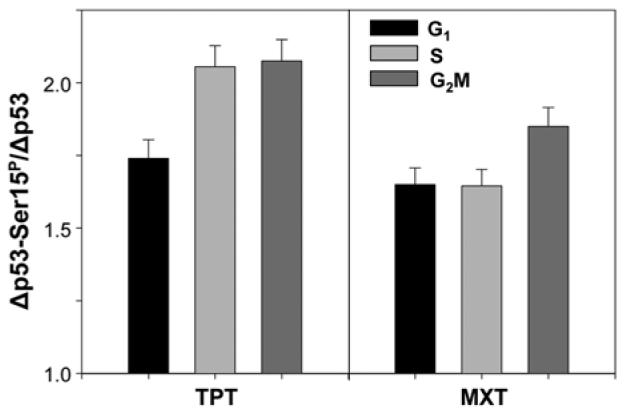
Effect of TPT and MXT on the proportion of p53-Ser15P versus total p53. A549 cells were untreated or treated with 0.15 μM TPT or 0.2 μM MXT for 5 h. Expression of cellular p53 and p53-Ser15P was detected with Ab that reacts with p53 regardless of its status of Ser15 phosphorylation (total p53) and with the phospho-specific Ser15P Ab, respectively, tagged with fluorochromes having different fluorescence emission (488 and 633 nm), as described in Materials and Methods. Cellular DNA was stained with DAPI. The data are presented as a the mean (±SD) ratio of the increase (Δ) of p53-Ser15P to the increase of p53 IF in treated cells over their constitutive levels in untreated cells, estimated by gating analysis for G1, S and G2M cells.