
Fig. 2.
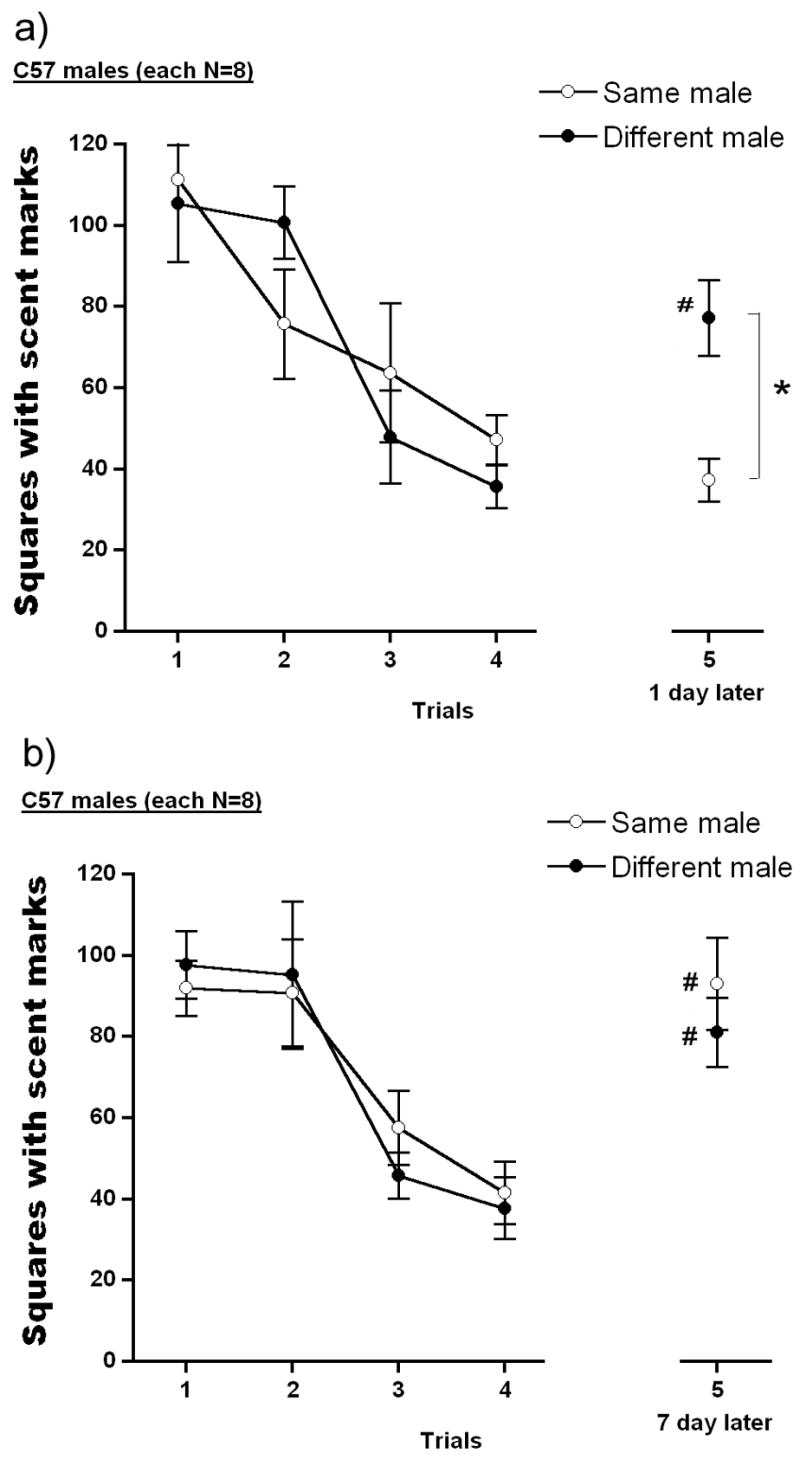
Number of squares with scent marks of C57 males which were confronted with the same, initially novel, CD-1 male during the first 4 trials, and then on 5th trial, exposed to the same CD-1 male (same male) or a different, novel CD-1 male (different male). The inter-trial interval was 24 hrs on the first 4 trials, and on 5th trial 24 hrs (upper panel) or 7 days (bottom panel). Data are expressed as mean ± S.E.M. Significant post hoc differences between groups; *p<.05, and between trials compared to trial 4, #p<.05..