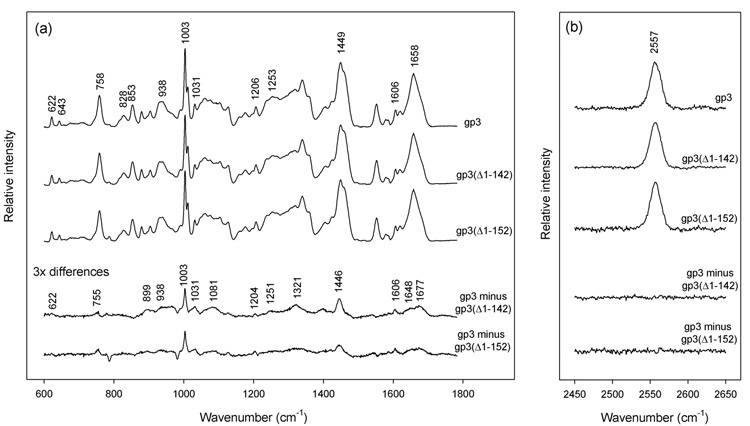
Figure 2.
Raman spectroscopy of nonameric ring assemblies of the full-length wildtype gp3 protein and C-terminal truncates gp3(Δ1–142) and gp3(Δ1–152). Solutions of purified rings were concentrated to ~20 mg/mL in 10 mM tris (pH 7.8), 0.1 M NaCl and sealed in 1 mm glass capillaries maintained at 20 °C. Raman spectra were excited at 532 nm (Verdi-5 laser, Coherent, Palo Alto, CA) and collected in the 90° scattering geometry (Spex 500M spectrograph, JY Horiba, Edison, NJ). Standard corrections for contributions of the buffer and glass were applied.26 (a) From top-to-bottom: Spectra in the region 600–1800 cm−1 of rings formed by full-length gp3, C-terminal truncate gp3(Δ1–142), C-terminal truncate gp3(Δ1–152), corresponding difference spectra (amplified 3-fold) between full-length and truncated species, as labeled. The integrated intensity of the tyrosine marker at 643 cm−1 was employed as the internal intensity standard. (b) From top-to-bottom: Spectra in the region 2450–2650 cm−1 of rings formed by full-length gp3, C-terminal truncate gp3(Δ1–142), C-terminal truncate gp3(Δ1–152), and corresponding difference spectra, as labeled. The integrated intensity of the 2557 cm−1 band was employed as the internal intensity standard.

