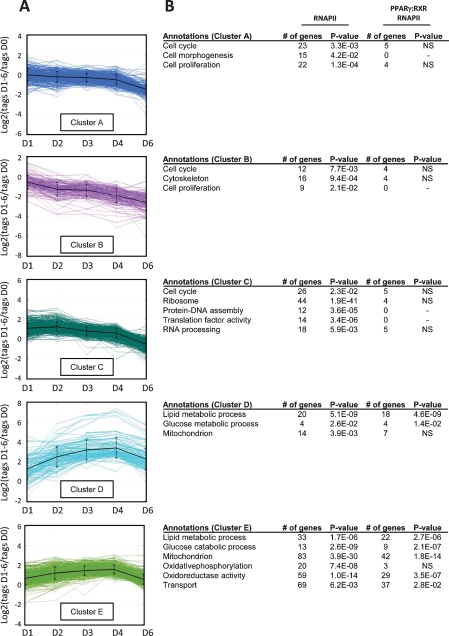
Figure 5.
Clustering of genes based on their changes in RNAPII occupancy during differentiation reveals five distinct clusters. RNAPII ChIP-seq was performed during differentiation, and the relative overall occupancy in the genes was calculated as described using Log2 ratios of RNAPII occupancy at each day relative to day 0. (A) Genes with regulated RNAPII binding were separated into five distinct clusters using the k-means algorithm with squared Euclidean distance. (B) The clustered genes were assigned to biological function based on GO using the web tool DAVID. The total number of genes within a given cluster that belongs to a particular GO category as well as the P-value for the category is indicated (RNAPII). The number of genes with associated PPARγ:RXR target sites is listed with the corresponding P-values (PPARγ:RXR RNAPII). Significance level: P < 0.05; (NS) not significant.

