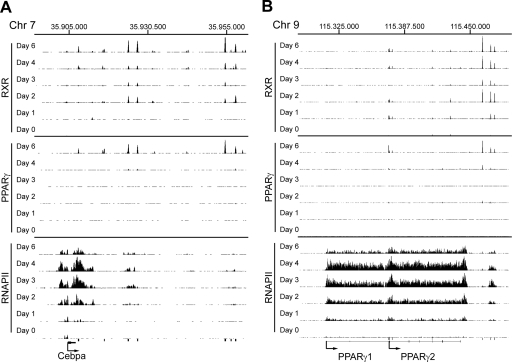
Figure 6.
PPARγ:RXR binding and RNAPII occupancy at Cebpa and PPARγ loci. ChIP-seq data are viewed in the University of California at Santa Cruz browser for the Cebpa locus (Y-axis scale on PPARγ and RXR tracks 10–90 and RNAPII tracks 5–50) (A) and the PPARγ locus (Y-axis scale on PPARγ and RXR tracks 10–200 and RNAPII tracks 5–60) (B). Black bars below the tracks indicate PPARγ:RXR target sites detected at day 6.

