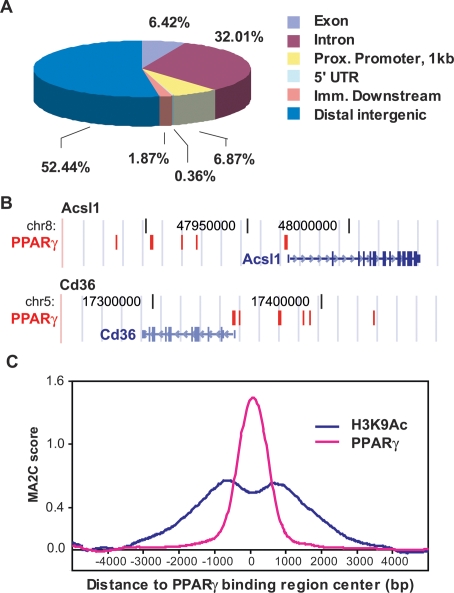
Figure 1.
Location analysis of PPARγ-binding sites. (A) PPARγ-binding regions were mapped relative to their nearest RefSeq genes using CEAS (Ji et al. 2006). Proximal (prox.) promoter was defined as ≤1 kb upstream from the TSS. Immediate (imm.) downstream was defined as ≤1 kb downstream from the 3′ end of the gene. Distal intergenic refers to all locations outside the boundaries of a gene and the 1 kb flanking the gene on either end. (UTR) Untranslated region. (B) PPARγ-binding regions are frequently clustered around target genes. Two PPARγ target genes, Cd36 and Acsl1, are shown in their native chromosomal locations according to the February 2006 Mouse Genome Assembly (mm8) in the UCSC Genome Browser (http://genome.ucsc.edu). Red blocks represent regions of enriched PPARγ-binding signal. Vertical lines within the genes represent exons, horizontal lines represent introns, and arrowheads represent the direction of transcription. (C) Enrichment of acetylation at Lys 9 of histone 3 (H3K9Ac) in the regions of PPARγ binding. Shown are the average ChIP–chip profiles for PPARγ and H3K9Ac across 740 PPARγ-binding regions located >10 kb from a TSS. MA2C score refers to the enrichment at each location along the 10 kb distance that was tiled on the custom array for each region.

