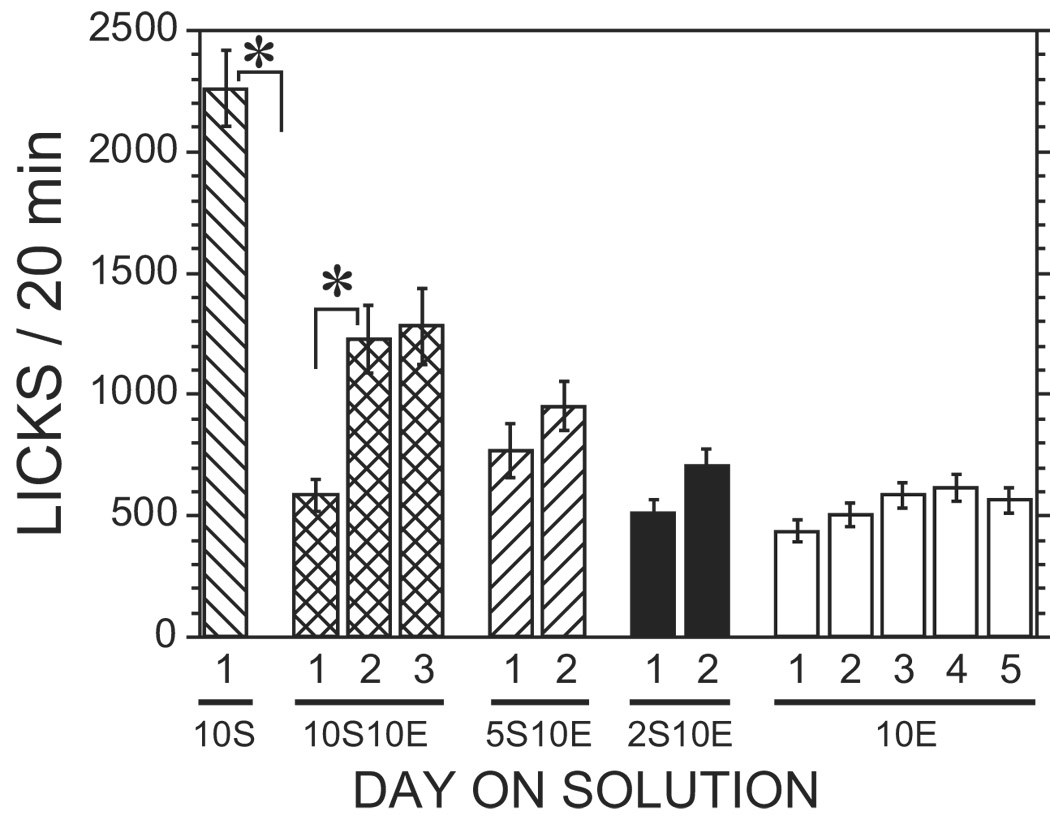
Fig. 2.

Ethanol intake (licks) during the various stages of the protocol. The licks represent the ethanol consumption during the operant self-administration of the last day of 10% sucrose, the first three days of 10% sucrose and 10% ethanol, the two days of 5% sucrose and 10% ethanol, the two days of 2% sucrose and 10% ethanol, and the last five days of 10% ethanol. Ethanol intakes (licks) are presented as mean ± SEM (n=19–22). * indicates a statistically significant difference between the indicated groups by post hoc analysis after significance was found for the overall ANOVA.
