
Figure 2.
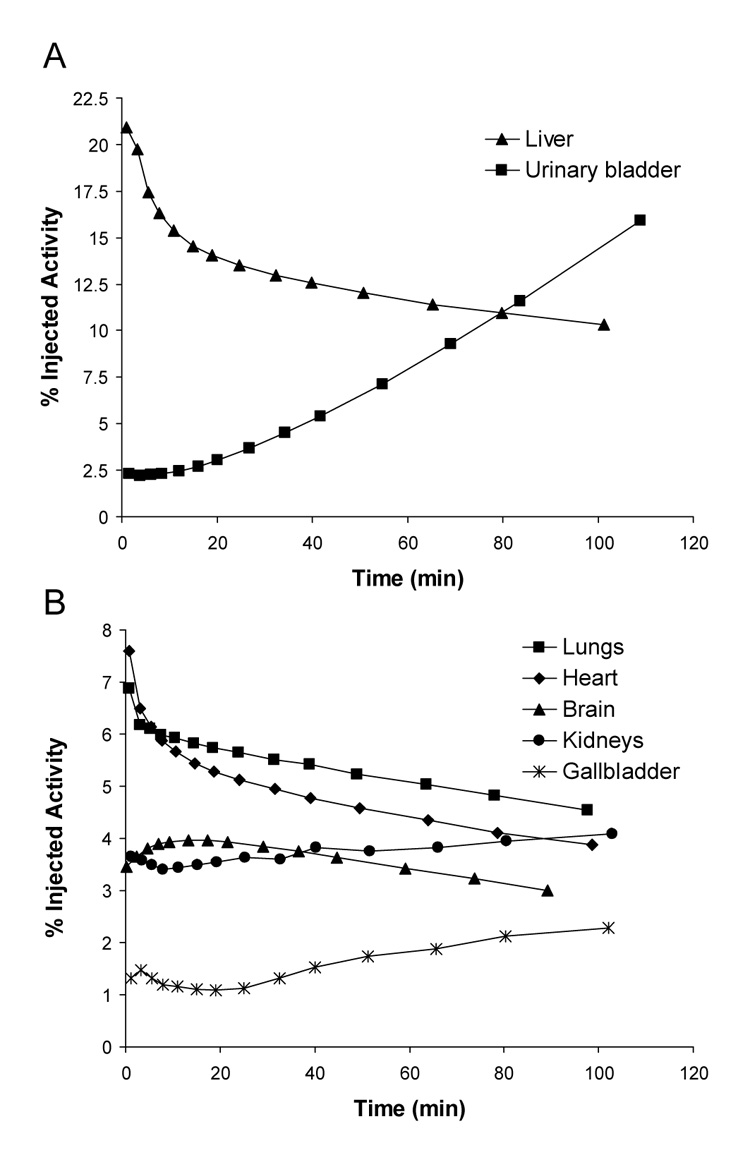
Mean decay-corrected activity in visually identifiable organs that have high (A) and low (B) uptake after injection of [11C](R)-rolipram in 8 human subjects. Activities were determined from 2D planar images.
Official websites use .gov
A
.gov website belongs to an official
government organization in the United States.
Secure .gov websites use HTTPS
A lock (
) or https:// means you've safely
connected to the .gov website. Share sensitive
information only on official, secure websites.
Mean decay-corrected activity in visually identifiable organs that have high (A) and low (B) uptake after injection of [11C](R)-rolipram in 8 human subjects. Activities were determined from 2D planar images.