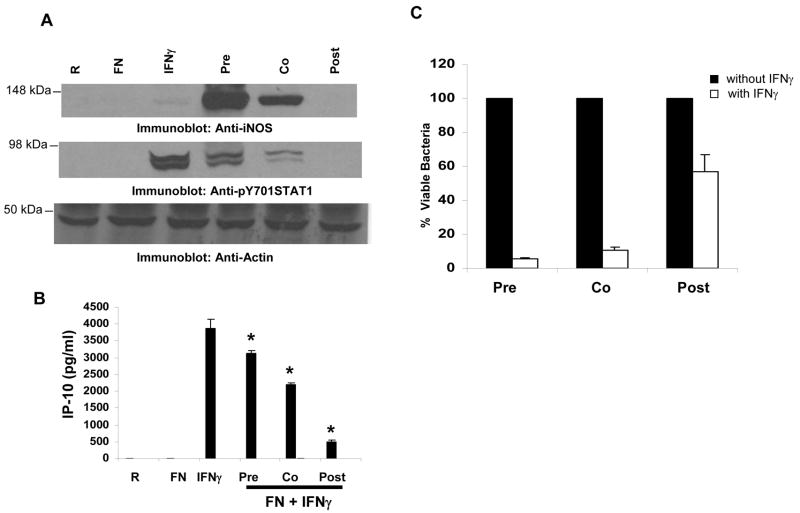
Figure 6. Francisella suppresses IFNγ-induced iNOS leading to enhanced bacterial survival.
A. RAW 264.7 cells were exposed to IFNγ 8 h prior to infection (pre), at the time of infection (co) or 8 h post-infection (post) for a constant IFNγ-exposure period of 24 hours and the cellular levels of iNOS and pY STAT1 were analyzed by Western blotting. The same membranes were re-probed with actin antibody. These data are representative of three independent experiments. B. RAW 264.7 cells were treated as described in A and the amount of IP-10 produced was measured by ELISA. The graph shows mean and SD of values obtained from triplicate samples. These data are representative of 3 independent experiments. * p<0.05 compared with the IFNγ value. R, resting. C. RAW 264.7 cells were treated as described in the Materials and Methods section to maintain a constant infection period within each of the three groups (pre, co and post) and a constant IFNγ exposure period across the three groups. CFUs in samples that were not treated with IFNγ were set as 100%. The CFUs obtained from the samples treated with IFNγ were expressed as a percent of the corresponding non-IFNγ treated sample. The graph shows the mean and SD of values obtained from 3 independent experiments.

