
Figure 2.
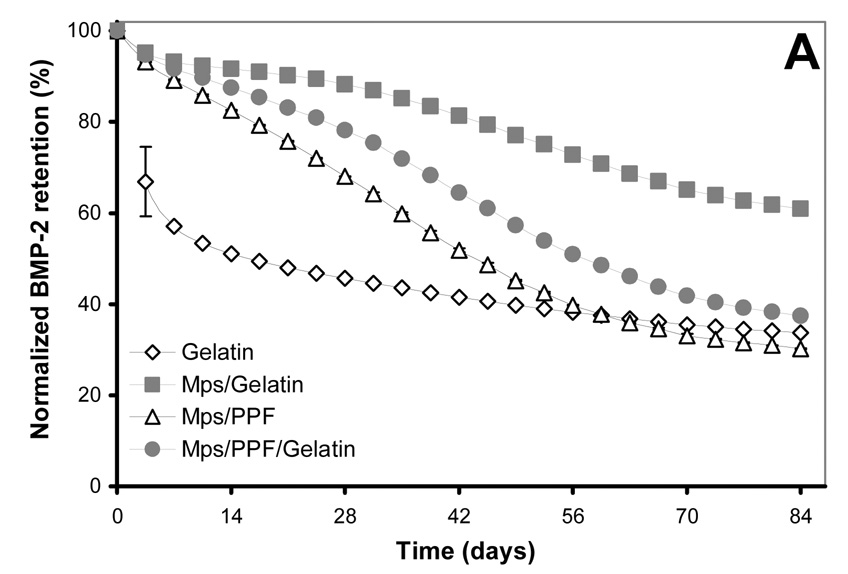
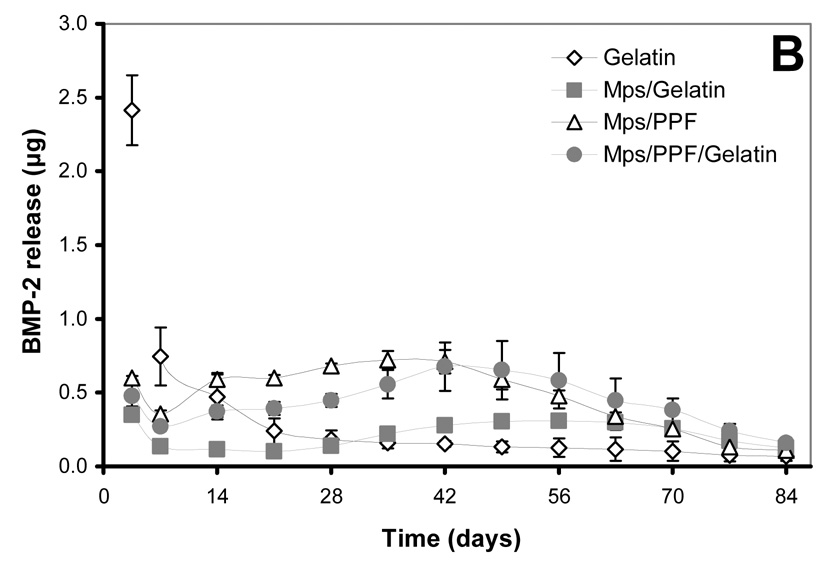
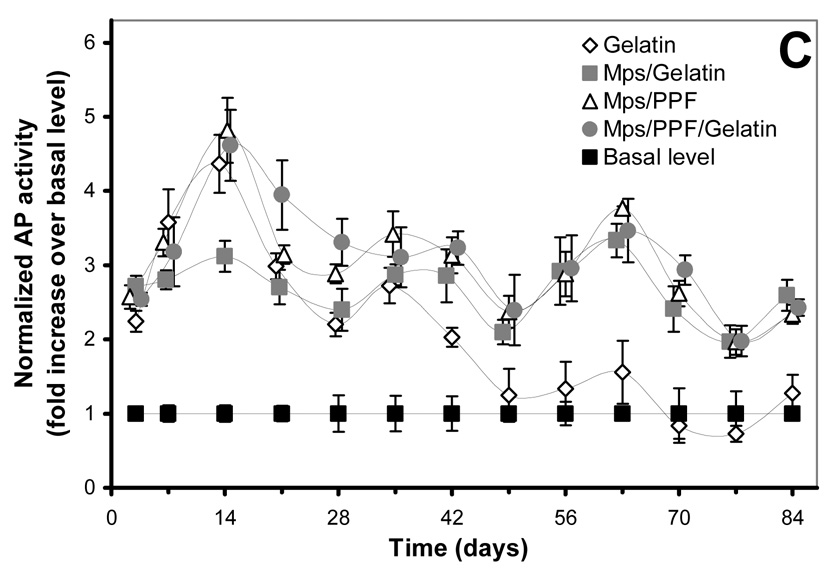
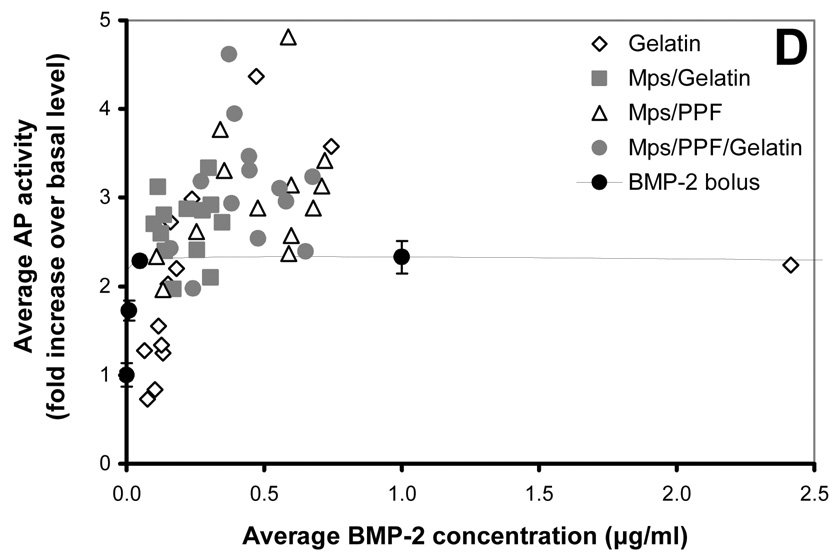
125I-BMP-2 release kinetics from the implants and its bioactivity on consecutive W20-17 cell cultures. The in vitro 125I-BMP-2 release profiles are expressed as (A) normalized release (% of the initial loading) and (B) amount of released protein (in µg) from the 4 different implants at 37 °C in the culture media. (C) AP activity of consecutive new W20-17 cell cultures exposed to empty transwells (basal level) or transwells containing the BMP-2 implants. The alkaline phosphatase activity was normalized to the cell protein contents and expressed as an increase over the basal levels for each time point. (D) Relationship between the BMP-2 concentration in the culture medium (obtained from B) and the normalized alkaline phosphatase activity (obtained from B). The line (●) shows the dose-response curve of cell cultures treated with media containing 0.0, 0.01, 0.1, 1.0 and 5.0 µg BMP-2/ml.