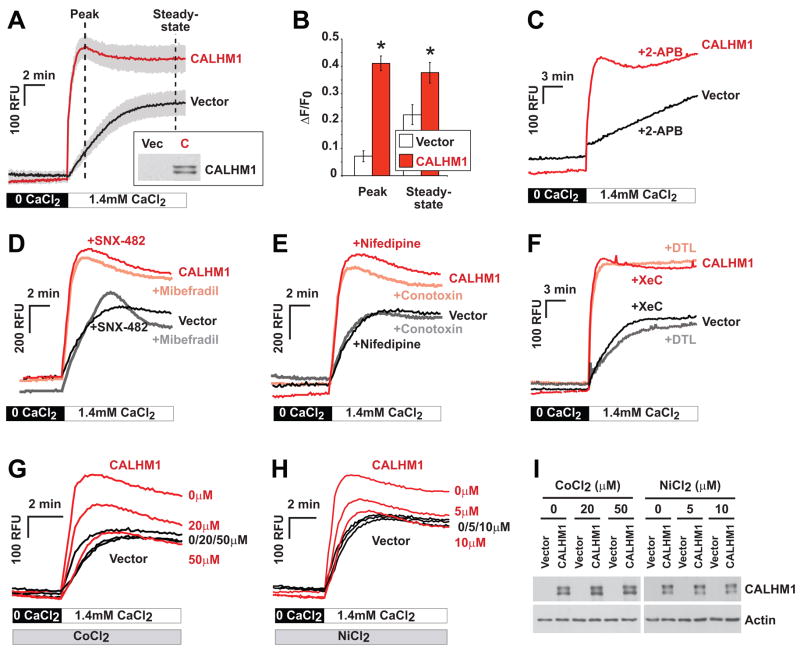
Figure 3. CALHM1 controls Ca2+ influx by a mechanism that does not promote VGCC or SOCE channel activation.
(A) Cytoplasmic Ca2+ measurements using Fluo-4 loading and Ca2+ add-back assays in HT-22 cells transiently transfected with Myc-CALHM1 or control vector. Cells were first incubated in Ca2+-free buffer (0 CaCl2) and then challenged with physiological extracellular Ca2+ concentrations (1.4 mM CaCl2) to monitor the progressive restoration of basal [Ca2+]i. Traces illustrate the mean relative fluorescence units (RFU) +/− S.D. (shaded areas) of three independent experiments. Inset, WB of the corresponding cell lysates probed with anti-Myc antibody (Vec, vector; C, CALHM1).
(B) Peak and steady-state of [Ca2+]i measurements as in (A) expressed in ΔF/F0 (*, P<0.001; Student’s t test).
(C–H) Cytoplasmic Ca2+ measurements as in (A) in cells pretreated with 2-APB [50 μM, (C)], SNX-482 [0.5 μM, (D)], mibefradil [1 μM, (D)], nifedipine [10 μM, (E)], ω-conotoxin MVIIC [Conotoxin, 5 μM, (E)], dantrolene [DTL, 10 μM, (F)], xestospongin C [XeC, 2 μM, (F)], or with the indicated concentrations of CoCl2 (G) and NiCl2 (H). Traces in (C–H) illustrate representative measurements of 2–3 independent experiments.
(I) WB with anti-Myc (upper panels) and anti-actin (lower panels) antibodies of protein extracts obtained from cells treated as in (G) and (H).

