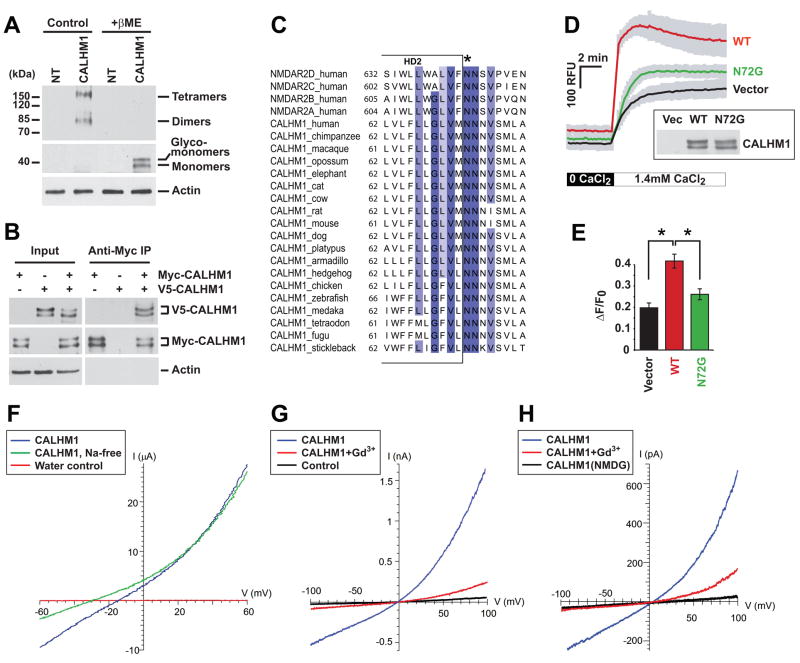
Figure 4. Ion channel properties of CALHM1.
(A) Lysates from non-transfected (NT) and Myc-CALHM1-tranfected HEK293 cells were analyzed by WB in the absence (Control) or presence of β-mercaptoethanol (+βME) using anti-Myc (two upper panels) and anti-actin (lower panel) antibodies.
(B) Lysates from HEK293 cells transfected (+) or not (−) with V5-tagged CALHM1 (V5-CALHM1) or Myc-CALHM1, were immunoprecipitated with anti-Myc antibody. Total lysates (Input, left panels) and immunoprecipitates (Anti-Myc IP, right panels) were analyzed by WB using antibodies against V5 (upper panels), Myc (middle panels), and actin (lower panels).
(C) Partial sequence alignment of human NMDAR NR2 (NMDAR2) subunits A–D and CALHM1 from various species. Sequence conservation is highlighted in a blue gradient as described in Fig. 1A. Star denotes Q/R/N site.
(D) Cytoplasmic Ca2+ measurements in HT-22 cells transiently transfected with control vector and WT or N72G-mutated Myc-CALHM1. Cells were treated and results analyzed as in Fig. 3A (n = 3 independent experiments). Inset, WB of the corresponding cell lysates with anti-Myc antibody.
(E) Peak of [Ca2+]i measurements as in (D) expressed in ΔF/F0 (*, P<0.001; Student’s t test).
(F) Representative current traces during voltage ramps in Xenopus oocytes injected with CALHM1 cRNA (blue and green traces) or water (red trace) in normal LCa96 solution (blue and red traces) or in Na+-free LCa96 solution (replaced with equimolar N-methyl-D-glucamine (NMDG); green trace).
(G) Whole-cell currents in CALHM1-expressing (blue and red traces) or control (black trace) CHO cells in response to voltage ramps before (blue trace) and after (red trace) perfusion with 100 μM Gd3+. Bath contained 120 mM NaCl, pipette solution contained 122 mM CsCl (see Experimental Procedures). Cell capacitances of the CALHM1-expressing and control cells were 18.5 pF and 13.0 pF, respectively.
(H) Whole-cell currents in CALHM1-expressing CHO cells (uncorrected for leakage currents) in response to voltage ramps in bi-ionic Ca2+/Cs+ solutions (20 mM Ca-aspartate in bath, 120 mM Cs-aspartate in pipette; see Experimental Procedures) before (blue trace) or after (red trace) bath addition of 100 μM Gd3+(Cm = 24.1 pF). Reversal potential Vrev = +8.3 ± 2.9 mV (n = 7) after correction for liquid junction potential and leakage current, indicating PCa : PCs = 5. No currents were observed in CALHM1-expressing cells with NMDG-aspartate in bath and pipette solutions (black trace; Cm = 20.5 pF).

