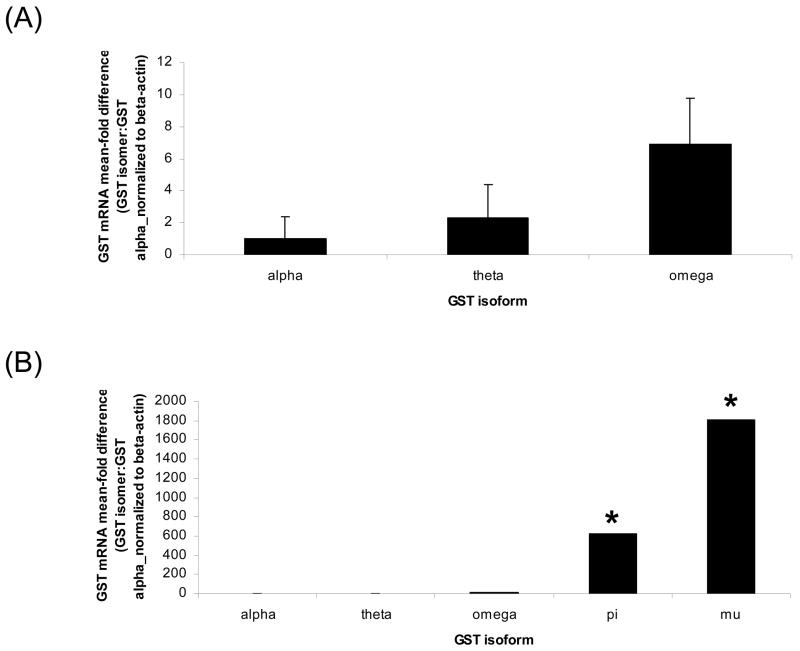
Figure 2. GST isoform distribution in unstimulated B6C3F1 PND4 mouse ovaries.
Total RNA was isolated from PND4 B6C3F1 mice as described in materials and methods. One microgram of total RNA was reverse transcribed to cDNA and analyzed for GST isoform and β-actin mRNA by RT-PCR. Values are mean fold level, ± SE; n=3 (8–10 ovaries per pool), relative to GST alpha. Values are mean ± S.E.; n=3.

