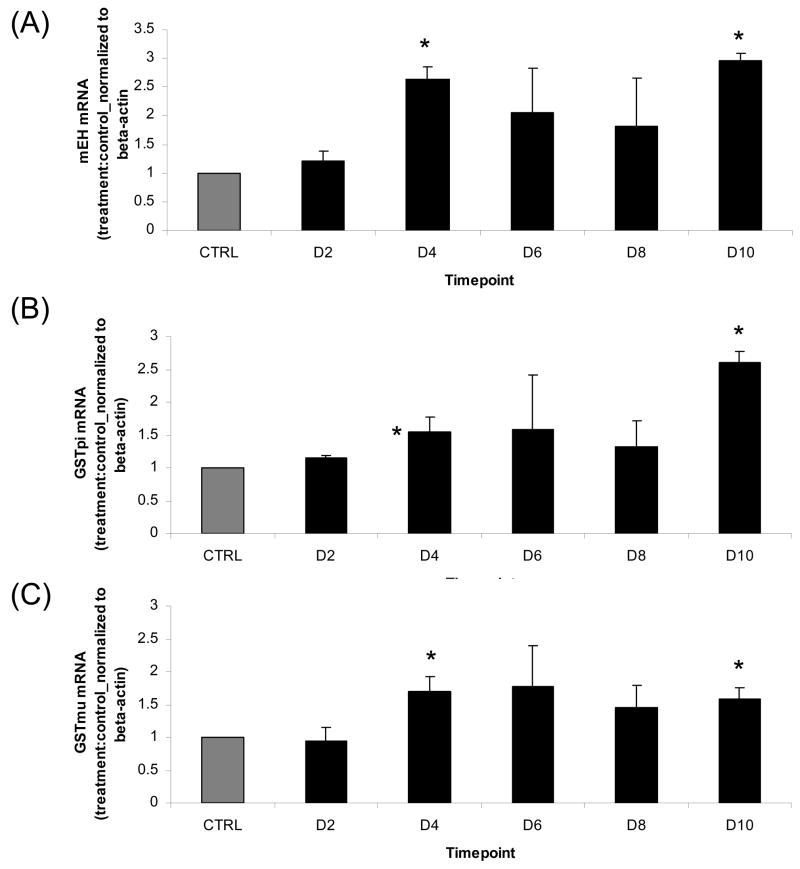
Figure 3. Time-course of VCD effect on mEH, GST pi and GST mu mRNA.
Ovaries from PND4 B6C3F1 mice were cultured with control medium or 15μM VCD for 2, 4, 6, 8, or 10d. Following incubation, total RNA was isolated as described in materials and methods. One microgram total RNA was reverse transcribed to cDNA and analyzed for (A) mEH, (B) GST pi, (C) GST mu and β-actin mRNA by RT-PCR. Values are mean fold change ± SE; n=3 (8–10 ovaries per pool). Values are mean ± S.E.; n=3. * Different (p<0.05) from control.

