
Figure 7.
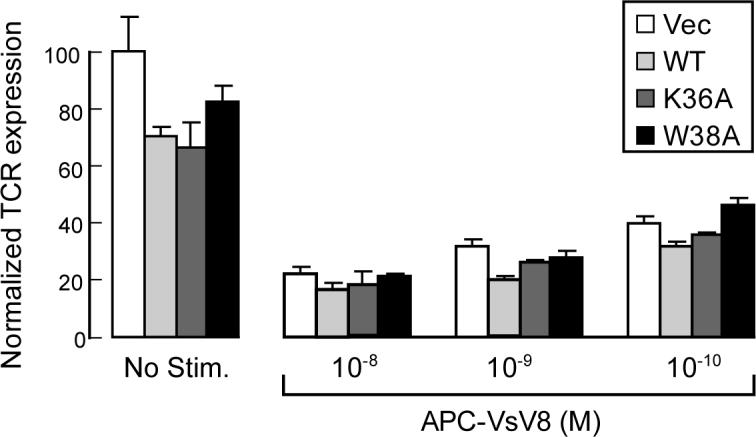
Downregulation of TCR expression by stimulation with different concentrations of the APC-VsV8 complex. TCR surface expression of LN CD8+ T cells transfected with either empty vector (Vec), wt Nck (WT), or mutants of Nck (K36A or W38A) were tested without stimulation and 3hrs after the activation with different concentration of VsV8-loaded APCs are shown. FACS analysis was done in the same way as in Figure 6. The indicated values are average of three separate experiments with error bars representing ± SD of the mean.