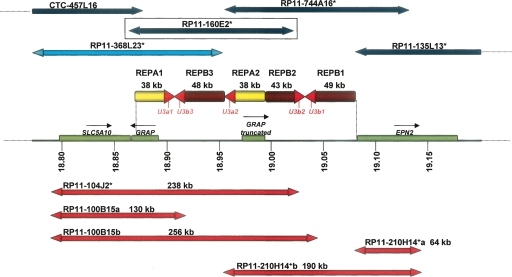
Figure 1.
The i(17)q cluster breakpoint genomic architecture at 17p11.2 is depicted; the positions are given relative to NCBI build 35. The horizontal line depicts the high-resolution physical map of the i(17q) breakpoint cluster region (REPA/B region) on chromosome 17 with coordinates (in Mb) listed below (Barbouti et al. 2004); genes are shown as green rectangles; yellow and brown arrows represent REPA and REPB, respectively; red arrowheads of REPAs and REPBs represent a nearly identical 4-kb sequence shared among both REPAs and REPBs that includes the SNORD3@ gene cluster (also known as U3). Above, horizontal dark blue arrows represent BAC clones positioned according to Barbouti et al. (2004); red arrows represent some of the BAC clones selected from RPCI-11 in this study. The BAC RP11-160E2, which was used in the statistical analysis, is boxed to emphasize its location. The double arrowheads represent the BAC ends. We sequenced the BAC forward and reverse ends and estimated their sizes and position along the genome. RP11-100B15 and RP11-210H14+ present two possible positions according to their end similarity to the reference genome, so we labeled these possibilities as a and b. Remarkably, clone RP11-210H14+ presented its forward and reverse ends matching to the same strand, suggesting an inversion of one of the REPB repeats. Clones marked with asterisks are present on the WGTP platform used in Redon et al. (2006).

