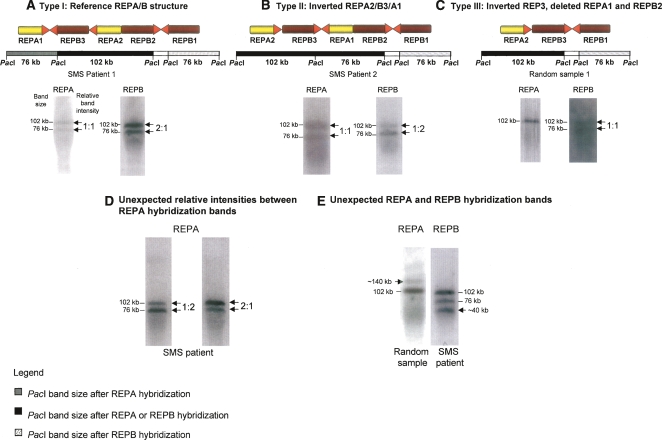
Figure 4.
REPA/REPB copy number polymorphism within the population using PFGE assay. Two different sample groups were used: Smith-Magenis patients carrying 17p11.2 deletions and random samples (refer to text for further details). (A–C) We detected and molecularly described three different REPA/REPB types (Types I, II, and III) based on PacI digestion and both REPA and REPB hybridization profiles of the DNA samples. Band sizes are shown at the left side of the hybridized membrane, whereas relative band intensities are shown on the right. (D,E) Other CNVs detected within these sample groups; each one belongs to a different individual and exemplifies either REPA or REPB variation. Contrary to Type I–III structures, we have no further evidence that allows us to assign a molecular genomic structure for those samples.

