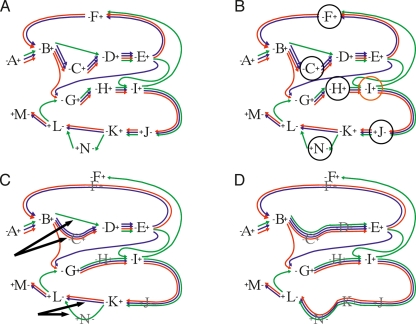
Figure 1.
Schematic diagrams showing the joining and annealing modifications within the Enredo graph. (A) The initial graph. The GPAs are shown as numbers, with pluses and minuses denoting their end vertices. In this schematic construction we do not show the link edges. The adjacency-edges are represented by a series of different color lines between the GPAs, representing the multiple species within their AESGs. (B, black circle) The GPAs which are trivially redundant in the graph, being connected to only two other GPAs; these can be removed without effect. GPA I (orange circle) is not redundant because H∗–∗I is not contiguous with respect to all the segments in the AESG of I∗–∗J. (C) The result of such removal. The black arrows show subgraph edges that are redundant at an edit distance of 1; these edges are then merged leaving the graph shown in D.

