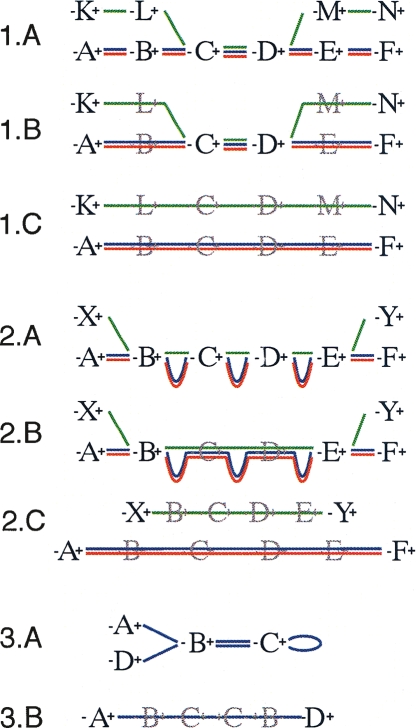
Figure 2.
Schematic diagrams representing the three secondary modifications within the Enredo graph. The graph representation mirrors that in Figure 1. (1) Splitting small edges. (1.A) An initial set of GPAs on three genomes in which the green sequence contains a small region apparently homologous to the others. (1.B) The graph after removing redundant GPAs. GPAs C and D represent breakpoints in the graph only because of the green sequence. (1.C) The effect of splitting the green sequence from the others and removing new redundant edges. (2) The removal of retrotransposed pseudogenes paired with a homologous gene. (2.A) Typically GPAs match exons rather than introns, therefore a retrotransposed pseudogene can show a high similarity at the level of GPAs with the homologous gene, although adjacent-edges will be much smaller (green sequence). (2.B) The graph after removing redundant GPAs. The AESG of B∗−(C,D)−∗E contains two segments much longer than the third one. (2.C) The effect of separating the putative retrotransposed pseudogene from the other segments. Usually this results in the creation of a longer AESG after removing new redundant edges. (3) The removal of small circular paths. Here a palindromic circle, typically caused by short tandem repeats or transposition, is broken by the creation of the joined adjacency-edge A∗−(B,C)−∗D.

