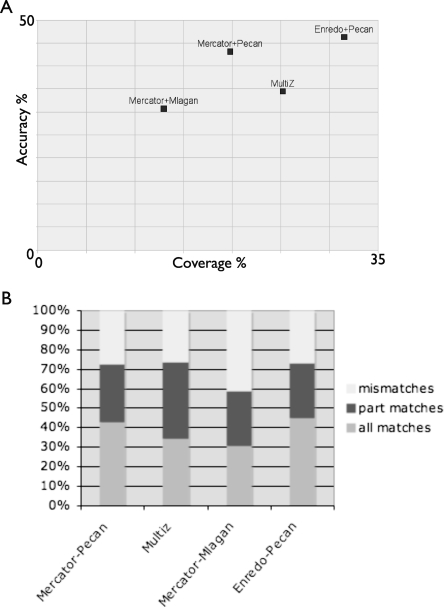
Figure 6.
(A) Plots showing the coverage and accuracy of different alignments to inferred ancient repeat sequences. Coverage is measured as the proportion of all ancient repeat bases aligned. Accuracy is measured as the proportion of all columns categorized as full matches. (B) A bar chart showing the distribution of different types of agreement (full, partial, and mismatch) to the repeat consensus alignment for different combinations of segmentation and alignment methods.

