
Figure 2. The dimeric interface.
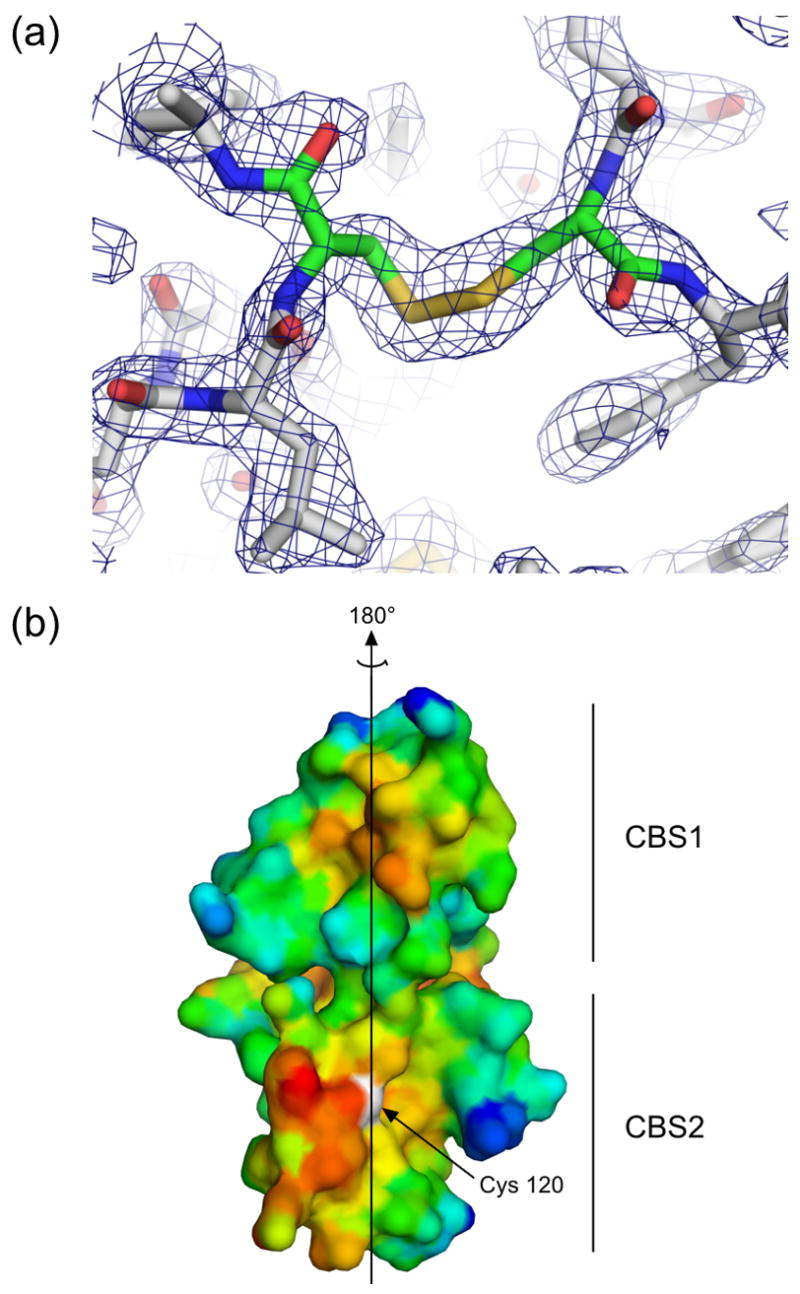
(a) Residues in the area of the disulfide bond in the unliganded structure are shown in stick representation, and electron density from a simulated annealing 2Fo-Fc omit map in which residues Cys120 and Cys120′ were omitted is contoured at 1.2 σ, demonstrating clear density for the disulfide bond. Similar density was seen for the disulfides in an omit map made using the coordinates and structure factors from the AMP-bound structure. (b) A surface representation of the dimeric interface of one subunit of PAE2072 is shown, colored according to hydrophobicity. Red indicates regions of higher hydrophobicity, while blue indicates more polar areas. The dimeric twofold axis is shown, and a prominent hydrophobic patch can be seen in each CBS domain. The sulfur atom of cysteine 120, representing the site of the intermolecular disulfide bond, is colored white.