
Figure 10. Expression of CCL3 and CD68 in CNS of kn-9H mice.
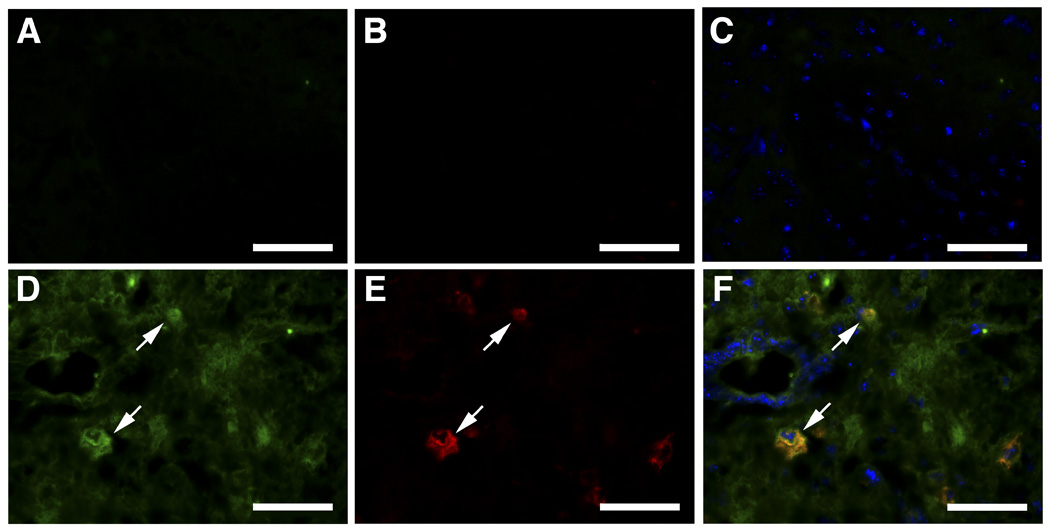
Spinal cord sections from kn-9H (bottom, D–F) and WT (top, A–C) mice were stained for CCL3 (FITC green, D, arrows) or anti-CD68 (Alexa-610 red, E, arrows). The co-localization of CD68 and CCL3 is shown in merged image (yellow, F, arrows). The magnifications are 400X; scale bar, 50 µm.