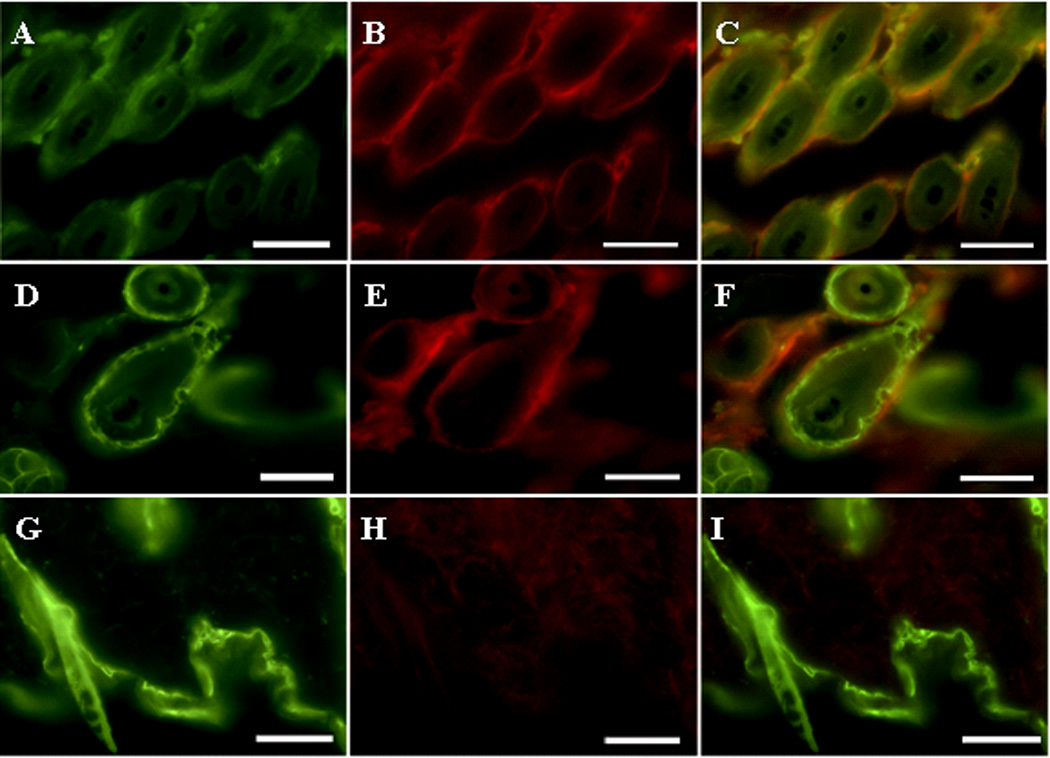
Figure 3. Immunofluorescence analyses of skin from kn-9H or WT mice.

Biopsies were analyzed using anti-mouse GCase (mGCase) or anti-Cre, or -K14, antibodies. (A–C) mGCase signals (A, FITC) and Cre (B, Alexa-610) were present in skin cells of kn-9H mice. The merged images (C) show co-localization of Cre and mGCase (i.e., the D409H protein). K14 (D, FITC) and Cre signals (E, Alexa-610) were detected in skin of K14-Cre mice. Panel F merges D & E. In WT mice, only K14 (G), but no Cre (H) signals were detected. The magnifications are 400X ; scale bar, 50 µm.
