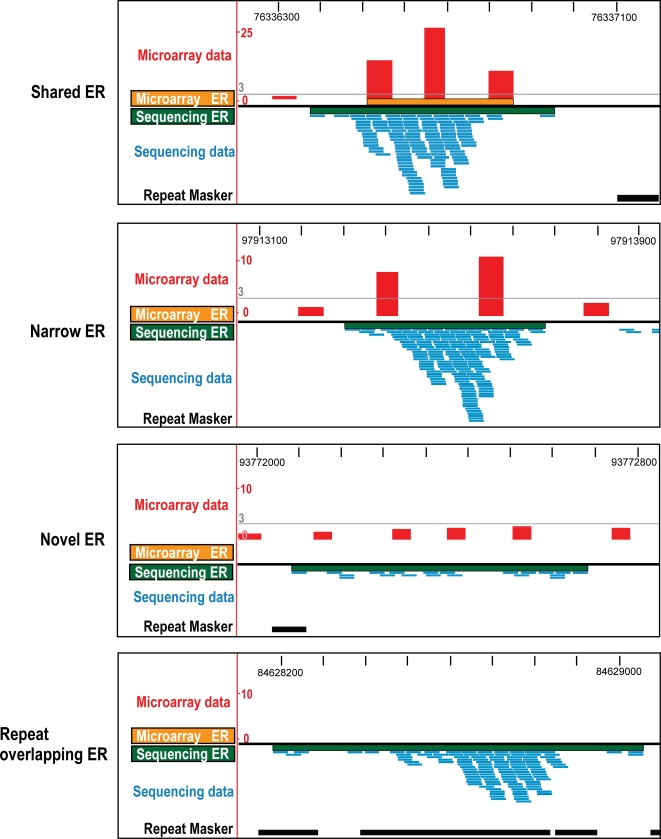
Figure 3. Visualization of matched ChIP-chip and ChIP-seq data for Hnf4α.
The four main categories (shared, narrow, novel, and repeat) are described in detail in Figure 2. The x-axis spans 1 kb of mouse chromosome 16 and the y-axis shows the fold enrichment for the microarray data and the depth of sequencing for the sequencing data. The threshold (3-fold) for the microarray-analysis is indicated as a grey line.

