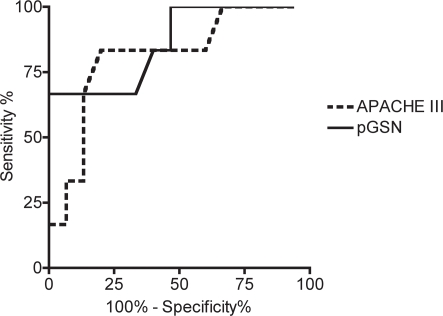
Figure 3. ROC analysis of pGSN and APACHE III.
Receiver operating curves of pGSN levels (solid line) and APACHE III scores (dotted line) identifying 28-day mortality in septic patients are generated. Area under curve is 0.86 for pGSN (95% confidence interval of 0.68–1.05, p = 0.011), and 0.81 for APACHE III (95% confidence interval of 0.60–1.02, p = 0.03. A pGSN level cutoff of <113.6 mg/L yields a 66.7% sensitivity and 93.3% specificity with a likelihood ratio of 10.

