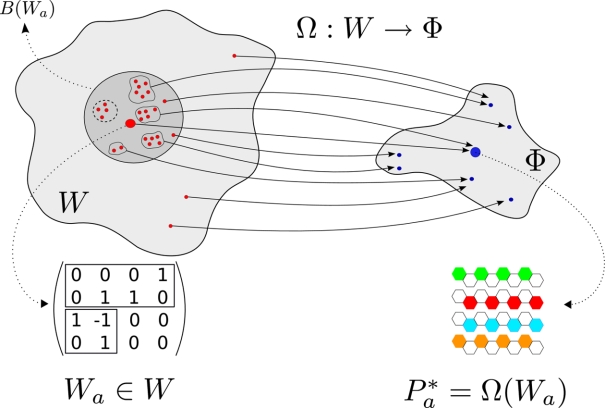
Figure 2. The genotype-phenotype mapping in the current model and for the case (N,H) = (4,2).
The mapping from the wiring space W to the expression pattern space Φ. In the wiring matrix, the larger rectangle isolates the G×N matrix A, while the smaller square represents the H×G matrix B. The one-link mutants (gray circle B(Wa) in W) of a genotype can relate to very diverse phenotypes.

