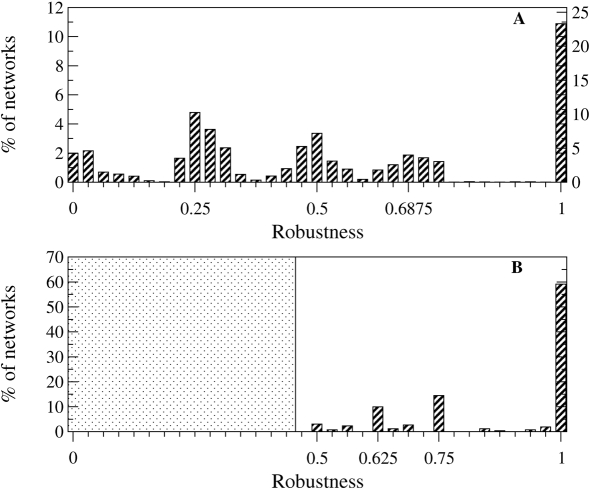
Figure 5. Robustness histogram for the networks producing non-null stable gene expression.
(A) For a better visualization, two normalizations have been used: for the left ordinate, using the entire set of stable networks (405 908 networks), and for the right ordinate, using the non-null stable networks (189 658 networks). (B) The robustness histogram for the 524 networks producing all stripes (Entropy H = 1; eq. 7 ). The dotted area puts in evidence that there are no H = 1-networks with robustness R<0.48.

