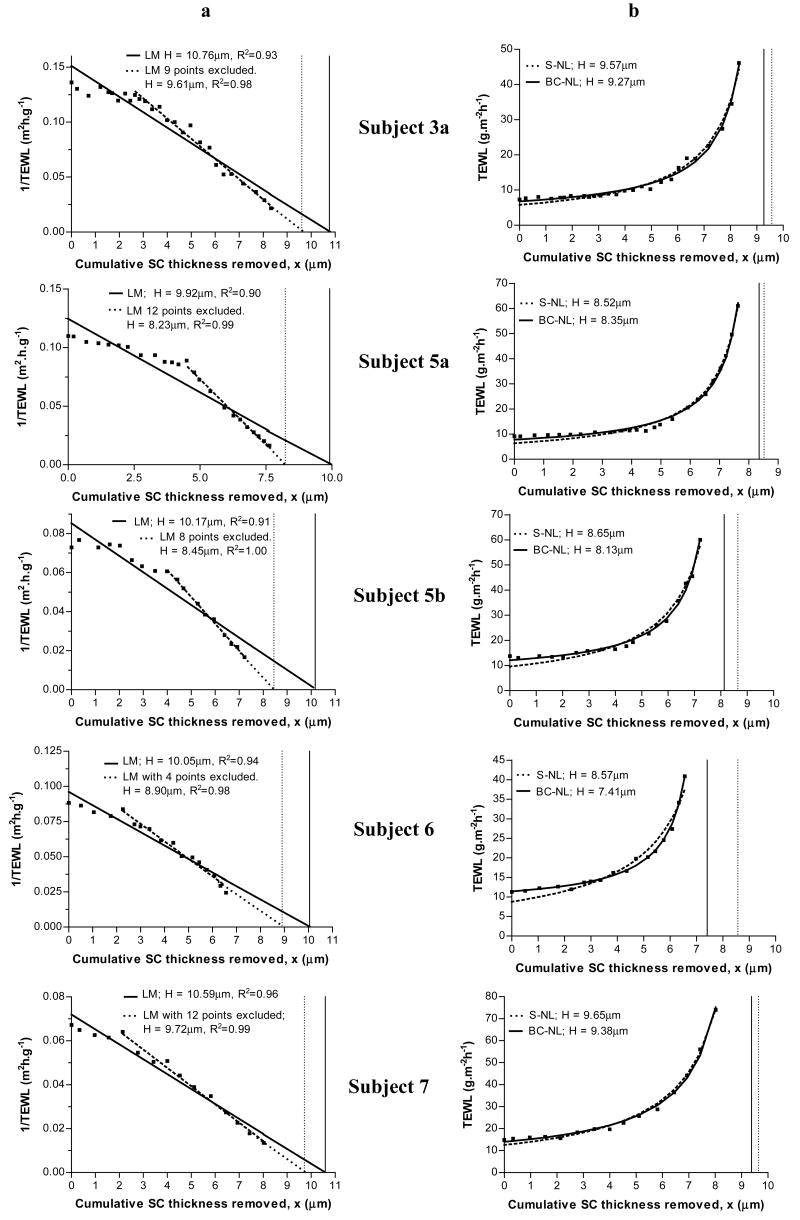
Figure 2.
Estimation of stratum corneum thickness (H) by the linear model (panel a) and by the simple (S-NL) and baseline corrected (BC-NL) non-linear models (panel b) for five subjects. [■] Experimental data points. Panel a: [–] prediction by LM including all experimental data; […] prediction by LM excluding a number of data points. Panel b: [–] prediction by BC-NL; […] prediction by S-NL model. The vertical lines mark the value of H estimated by: LM – all data points (panel a, solid line), LM – excluding data points (panel a, dotted line), the S-NL (panel b, dotted line) and the BD-NL (panel b, solid line).

