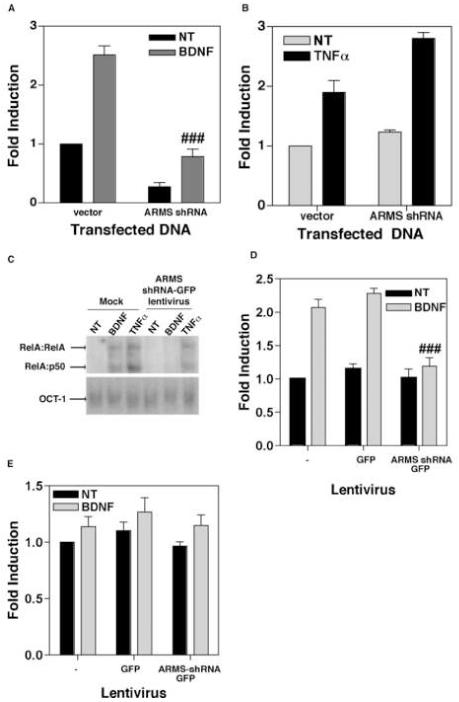
Figure 3.

(A) Depletion of ARMS reduces basal as well as BDNF-stimulated transcriptional activity of NF-κB. Primary cortical neurons were transfected with an NF-κB luciferase reporter plasmid plus either empty vector (vector) or plasmid expressing ARMS shRNA (ARMS shRNA). 40 hours post-transfection, the cells were treated with BDNF (100ng/mL) for 8 hours. Data shows that the loss of ARMS results in a reduction of NF-κB driven gene expression. (B) Analogous experiments were performed in HEK293 cells that were treated with TNFα (20ng/mL). Expression of ARMS shRNA had no effect on NF-κB elicited by TNFα. (C) Primary cortical neurons were either mock infected of infected with ARMS shRNA-GFP lentivirus. After 7 days, cells were exposed to either nothing, BDNF (100ng/mL), or TNFα (20ng/mL) for 2 hours. EMSA was then performed to analyze DNA binding activity of NF-κB and Oct-1(control transcription factor). Both BDNF-, and TNFα-treatment led to increased binding of NF-κB complexes (RelA:RelA and RelA:p50 are indicated) in mock infected cells. Cells expressing ARMS shRNA-GFP exhibited increased activity of NF-κB only in response to TNFα, but not BDNF. In all the cases, activity of Oct-1 remained unaltered. (D) Quantitative analysis of the DNA binding activity of NF-κB after expression of ARMS shRNA. A TransAM NF-κB DNA binding ELISA was performed using nuclear extracts of GFP and ARMS shRNA-GFP infected primary cortical neurons. BDNF was unable to stimulate DNA binding activity in cells expressing the ARMS shRNA. (E) The loss of ARMS does not effect DNA binding activity of NF-YA in a TransAM NF-YA DNA binding ELISA. The results presented here are derived from two (C), three (B and D), and four (A) sets of experiments. Data represents Mean ± SEM of fold induction as a function of the luciferase activity in untreated (and vector-transfected) cells; ### shows P<0.01 (A) and P<0.05 (D), as compared to BDNF-treated control groups. Vehicle-treated cells are shown as ‘NT’.
