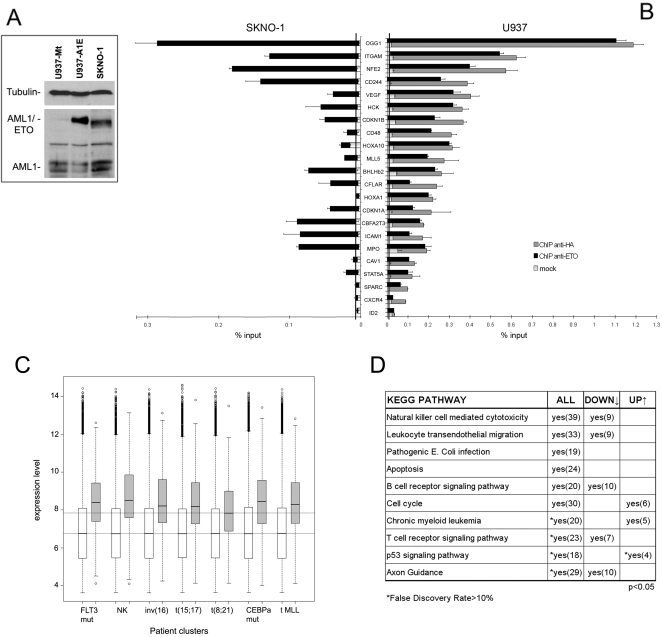
Figure 1. Identification of AML1/ETO binding regions in human promoters.
(A) Expression of AML1/ETO protein in U937-AE cells treated for 8 hours with 100 µM ZnSO4 and in patient-derived SKNO-1 cells was investigated by Western blotting using an anti-AML1 antibody. U937-Mt cells were used as negative control. The apparent difference in molecular weight between the two cell lines was due to the HA-tag domain. The two AML1 isoforms are also detected. Anti-tubulin antibody was used for normalization of protein levels. (B) 22 putative target genes were validated by qChIP in U937-AE cells using anti-ETO (black bar) and anti-HA (dark grey bar) antibodies, and in SKNO-1 cells using the anti-ETO antibody. For U937-AE cells, the light grey portion on each bar represents the level of enrichment in the U937-Mt cell line using the anti-HA antibody. In SKNO-1 cells, the mock ChIP was performed using Protein G beads alone. The baseline (represented as a vertical black line on each graph) corresponds to the mean level of enrichment obtained by qChIP on 8 negative control genes (see text and Figure S1). (C) Box-plot representing expression levels in AML samples of AML1/ETO target genes identified by ChIP-chip and expression profiling (approximately 70% of these were included in the array used for the study [28]). Seven representative clusters are shown, including the group of t(8;21) AML. The predominant chromosomal aberration or gene mutation characterizing each cluster is reported below the graph (FLT3 mut, normal karyotype (NK), inv(16), t(15;17), t(8;21), CEBPa mut and t-MLL correspond to clusters #2, #5, #9, #12, #13, #15, and #16, respectively, of the original study). White boxes represent expression levels of all genes on the array (lower horizontal line is the median value), grey boxes indicate expression levels of AML1/ETO downregulated targets (higher horizontal line is the median value in t(8;21) AML). (D) Functional pathways enriched in AML1/ETO target genes. The list of all AML1/ETO target genes (Table S1) and the sub-groups of up-regulated and down-regulated genes (Table S4) were functionally annotated using DAVID, and clustered according to the KEGG PATHWAY collection. The table reports categories significantly enriched in the three groups (p-value<0.05, False rate discovery <10%), number of genes retrieved in each pathway are also indicated.

