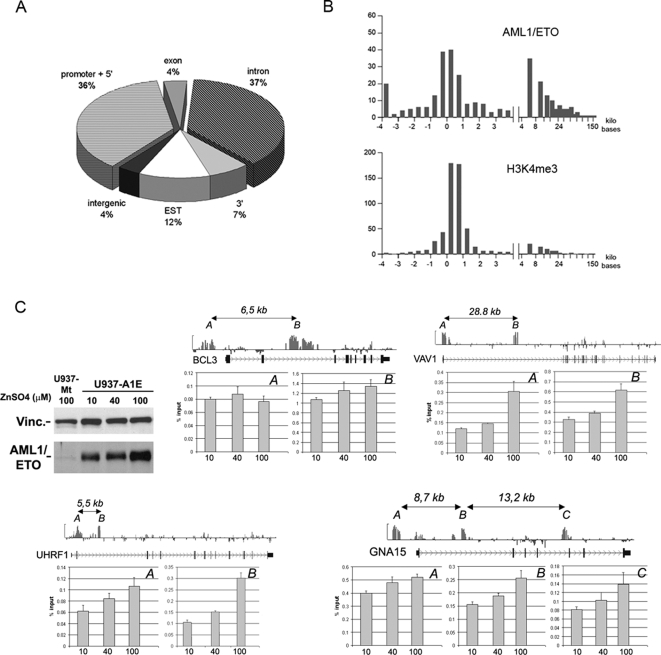
Figure 2. Topography of AML1/ETO binding on chromosome 19.
(A) AML1/ETO binding regions on chromosome 19: the pie plot shows the percentage of AML1/ETO peaks in different gene locations. “Promoter+5′” refers to the region comprised between −4 kb and +1 kb respect to the TSS. “3′” refers to the region comprised between the end of the last exon and 4 kb downstream. “Intergenic” refers to all regions that are neither within a gene nor in a region defined as “promoter+5′” or “3′”. Peaks that map in the proximity of transcripts that do not have a GeneBank ID but are present in the EST database were classified as “EST”. “Intergenic” refers to regions without any GeneBank ID or EST. (B) Distribution of AML1/ETO peaks with respect to TSS of annotated genes. Upper panel: distribution of AML1/ETO peaks along the gene body. X-axis indicates the distance from TSS (in kb), Y-axis shows the number of peaks inferred by PeakPicker software. Lower panel: distribution of H3K4me3 peaks, which map mainly within 1 kb from the TSS. (C) Four genes containing AML1/ETO peaks both in promoter and intragenic regions were analyzed for AML1/ETO binding at different fusion protein concentrations. Western blot shows AML1/ETO protein levels in U937-AE cells treated with 10, 40, and 100 µM ZnSO4 for 8 hours. BCL3, VAV1, and UHRF1 have two AML1/ETO binding peaks (A = promoter, B = intragenic), whereas GNA15 has three peaks (A = promoter, B and C = intragenic). For each gene, raw ChIP-chip data aligned to a scheme of the locus are shown above the graphs. AML1/ETO peaks are indicated as A, B, or C, and their relative distances are reported. ChIP experiments were performed using the anti-HA antibody on U937-AE treated with ZnSO4 at the doses indicated below the graphs. Variations in relative enrichment do not depend on location of peaks.

