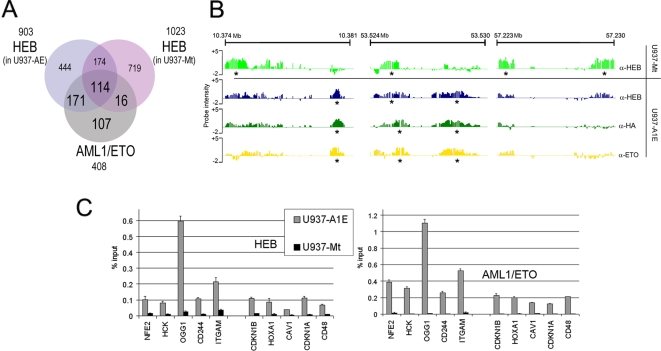
Figure 4. HEB binding pattern on chromosome 19.
(A) Venn diagram representing the overlap of HEB binding sites in U937-AE and U937-Mt cells with AML1/ETO binding sites on chromosome 19. Regions with at least 20% physical overlap were considered significant. (B) Screenshots of HEB and AML1/ETO occupancy on chromosome 19. Three representative regions show the displacement of HEB upon expression of AML1/ETO and highlight the similarity of the binding patterns of the two proteins in U937-AE cells. The two top lanes represent HEB binding profile in U937-Mt and in U937-AE. The two bottom lanes represent AML1/ETO binding patterns obtained with anti-HA and anti-ETO antibodies. Asterisks indicate peaks identified by PeakPicker software. (C) qChIP with an anti-HEB antibody analyzing the promoter of 10 genes regulated by AML1/ETO (5 downregulated: NFE2, HCK, OGG1, CD244, and ITGAM; and 5 upregulated: CDKN1B, HOXA1, CAV1, CDKN1A, and CD48) shows increased amounts of HEB in U937-AE (left graph). Right graph shows ChIP analysis of AML1/ETO protein on the same regions.

