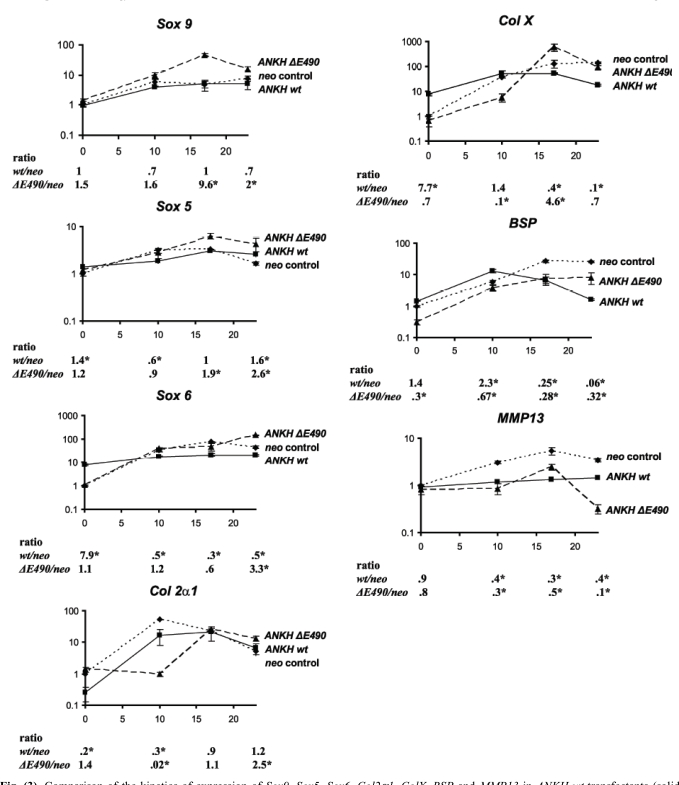
Fig. (3).
Comparison of the kinetics of expression of Sox9, Sox5, Sox6, Col2α1, ColX, BSP and MMP13 in ANKH wt-transfectants (solid lines) vs neo-controls (dotted lines) vs ANKH∆E490- transfectants (dashed lines) at D0, D10, D17 and D23 of ITS treatment. Expression of β-actin was used for normalization. Ratio denotes expression in ANKH-transfectants (either wt or ∆E490) over that of neo-controls. Arrow bars denote SD (n=4). * p-value<0.001 (Holm-Sidak method of pairwise multiple comparison).

