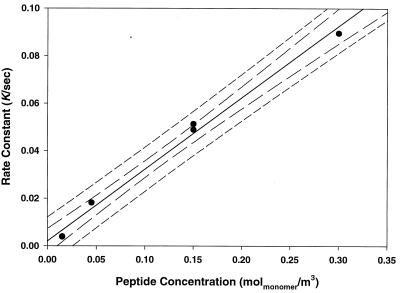
Figure 6.
The rate constant k in Eq. 1 plotted as a function of bulk Lac28 peptide concentration (expressed as monomer equivalent concentration). The line is the least-squares regression using all data. The 95% confidence and prediction intervals are also shown.

