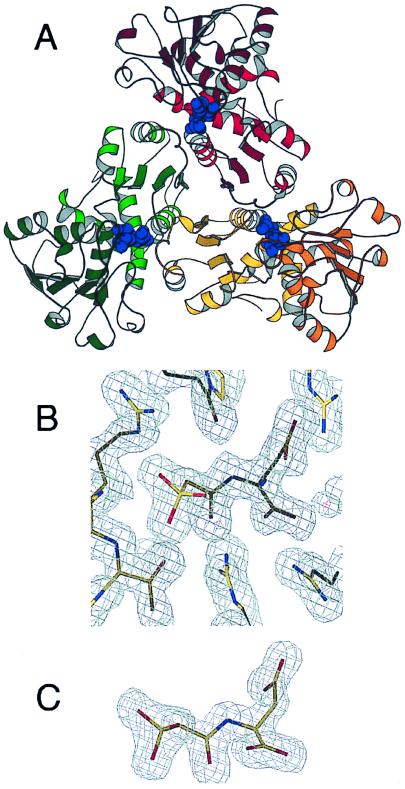
Figure 1.
Structure of the C trimer–PALA complex at 1.95-Å resolution. (A) Ribbon representation of the PALA-liganded C trimer. Each chain is shown in a different color with the N-terminal, carbamoyl-phosphate-binding domain (center), depicted in a lighter shade than the C-terminal, aspartate-binding, domain. PALA is shown in blue Corey–Pauling–Koltun rendering, highlighting both the interchain and interdomain location of the active sites. (B) 2Fo − Fc electron density map (contour level 1σ) in the region of the bound bisubstrate analog. (C) Omit Fo − Fc map of the inhibitor, PALA (contour level 3σ), using phases calculated from a model excluding the PALA molecule.

