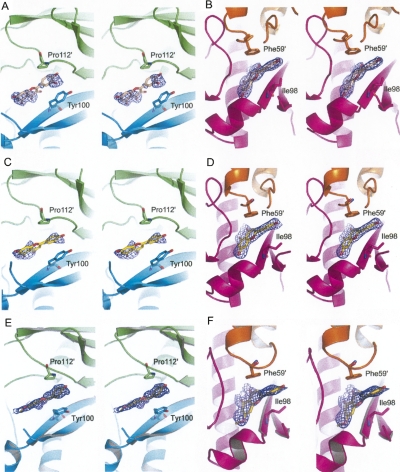
Figure 2.
Stereoview of the omit electron density maps contoured at 1.0 σ around quercetin (A,B), apigenin (C,D), and (S)-sakuranetin (E,F). Quercetin, apigenin, and (S)-sakuranetin are shown as sticks and colored in wheat, yellow, and olive, respectively. Monomers A, B, C, and D are colored in green, cyan, magenta, and orange, respectively. The pictures were generated using the program PyMOL (DeLano Scientific).

